Download This statistics in other country:
Timeline:
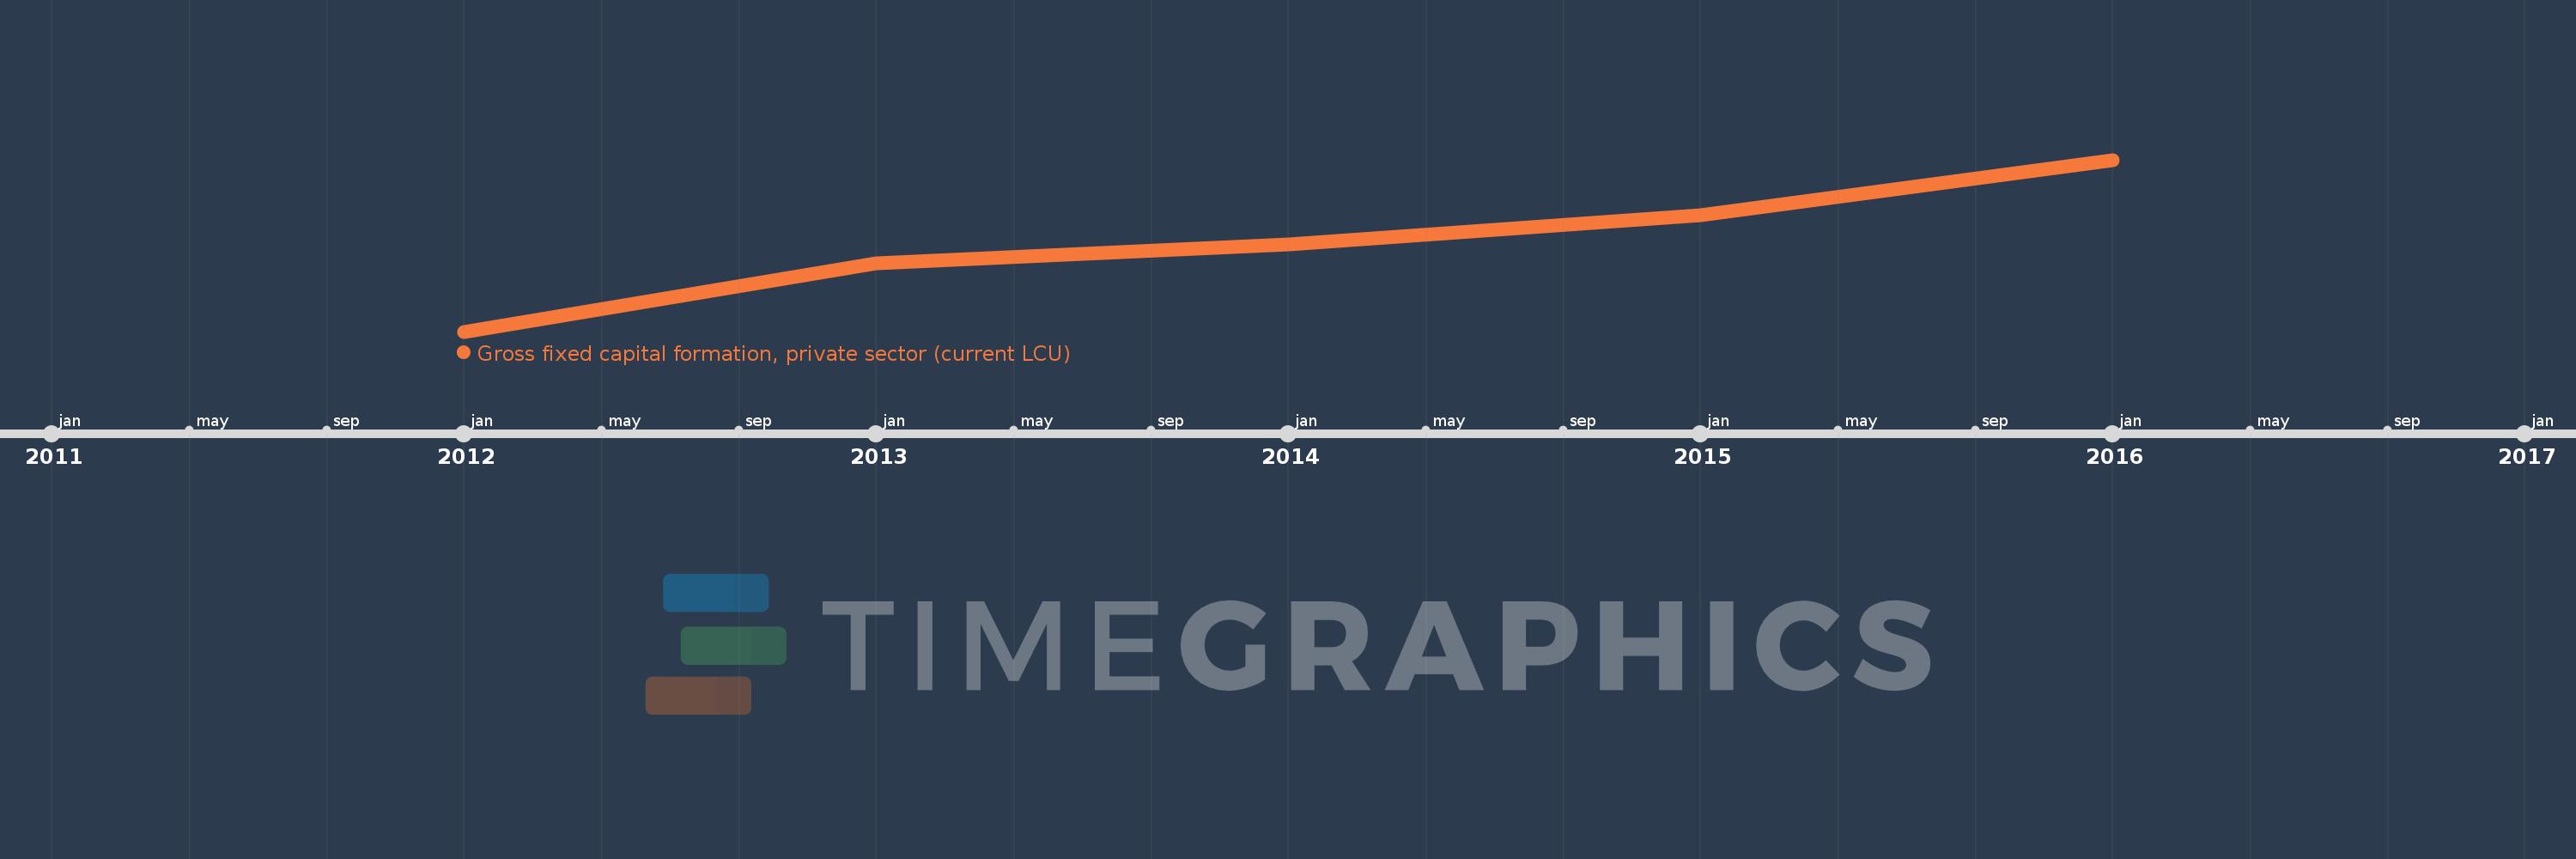
This timeline shows a graph from 2012 to 2016 of Ethiopia. No data until 2011. Number of actual observations by date: 5.
Source name:
World Development Indicators
Source organization:
World Bank national accounts data, and OECD National Accounts data files.
Categories, topics:
Economy & Growth
Last updated:
apr 23, 2017
Indicators value changes by year
Minimum:
70.572 bln
jan 1, 2012
Maximum:
303.262 bln
jan 1, 2016
At the date of observation
Value
Absolute change
Change from the previous value
jan 1, 2012
70.572 bln
+70.572 bln
0.0%
jan 1, 2013
163.003 bln
+92.431 bln
130.98%
jan 1, 2014
188.621 bln
+25.618 bln
15.72%
jan 1, 2015
228.415 bln
+39.794 bln
21.1%
jan 1, 2016
303.262 bln
+74.847 bln
32.77%
Ranking of countries by current statistics by years