Download This statistics in other country:
Timeline:
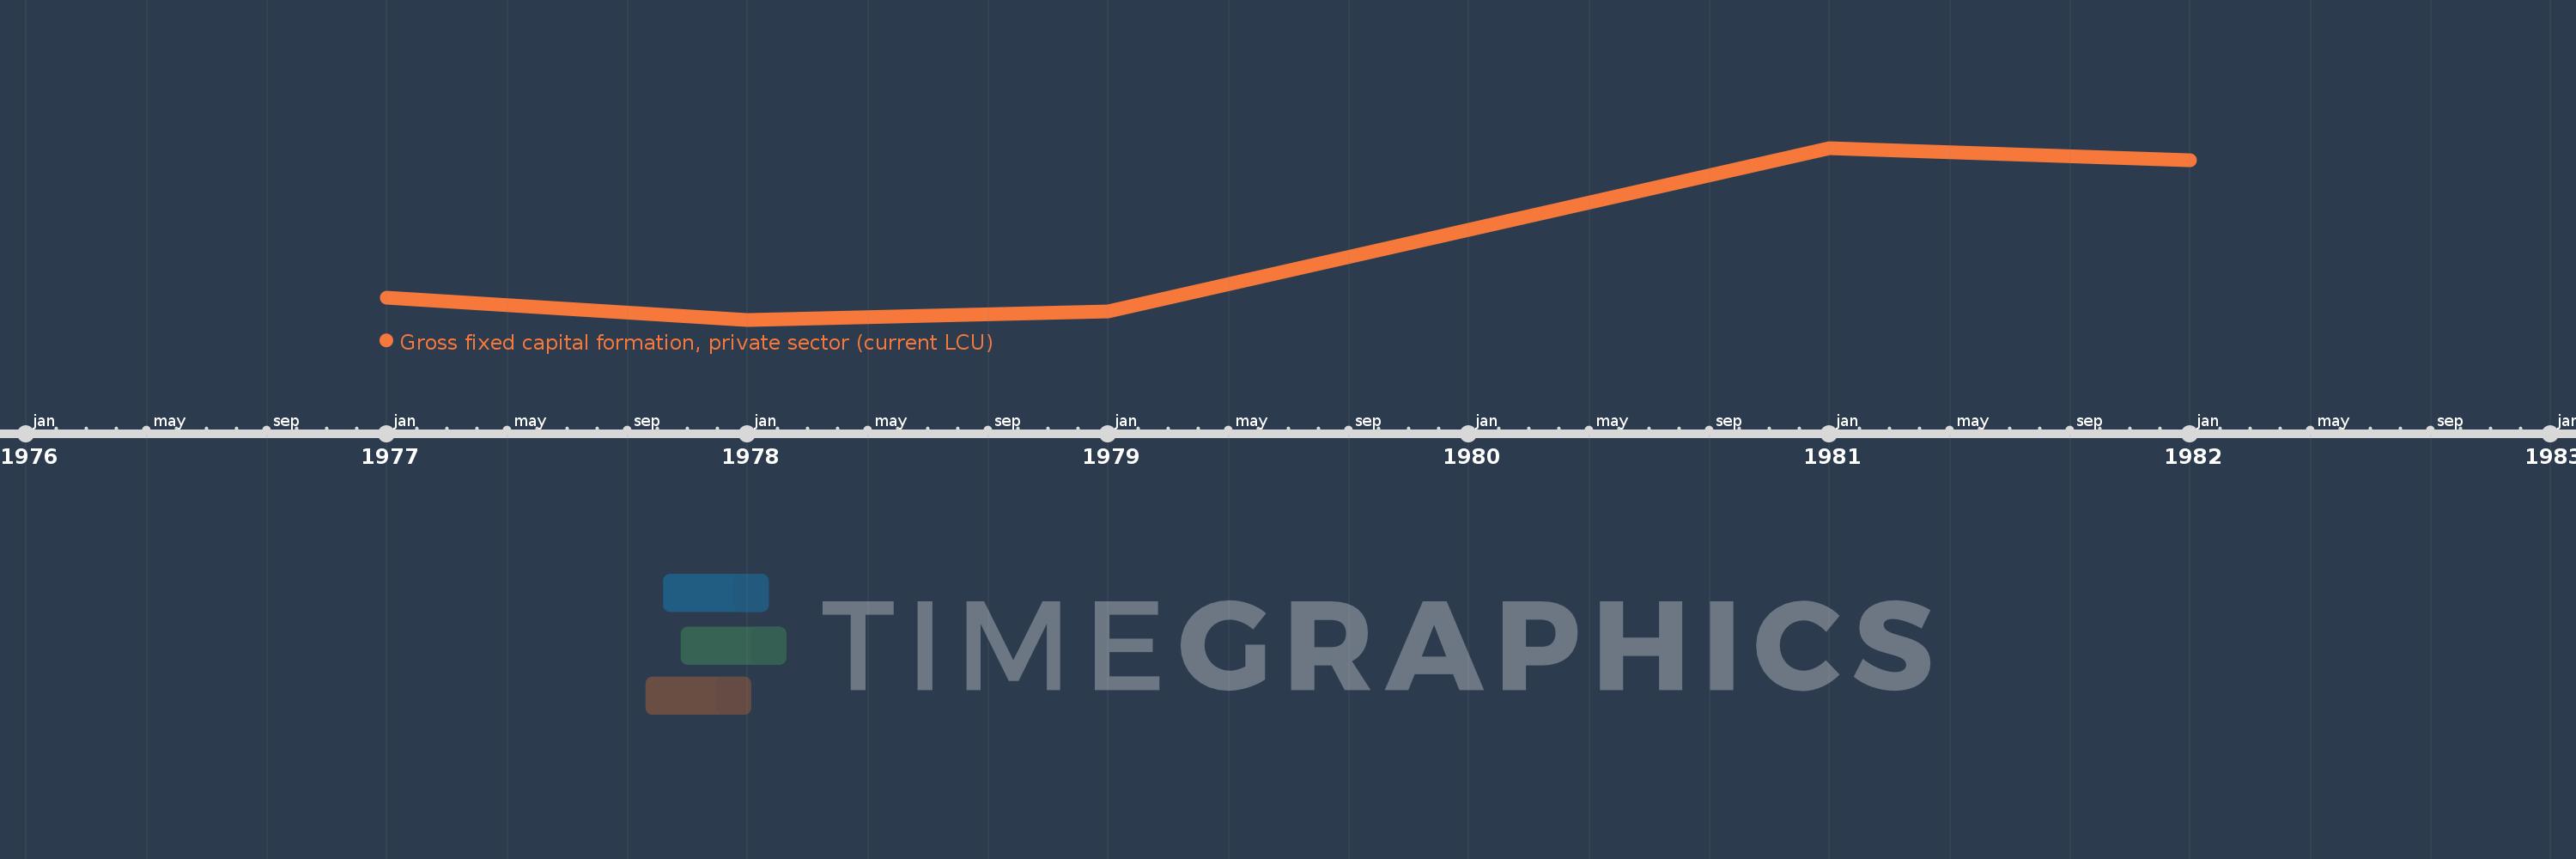
This timeline shows a graph from 1977 to 1982 of Lesotho. No data until 1976. Number of actual observations by date: 5.
Source name:
World Development Indicators
Source organization:
World Bank national accounts data, and OECD National Accounts data files.
Categories, topics:
Economy & Growth
Last updated:
apr 23, 2017
Indicators value changes by year
Minimum:
6.5 mln
jan 1, 1978
Maximum:
86.398 mln
jan 1, 1981
At the date of observation
Value
Absolute change
Change from the previous value
jan 1, 1977
16.7 mln
+16.7 mln
0.0%
jan 1, 1978
6.5 mln
-10.2 mln
-61.08%
jan 1, 1979
10.4 mln
+3.9 mln
60.0%
jan 1, 1981
86.398 mln
+75.998 mln
730.75%
jan 1, 1982
80.512 mln
-5.886 mln
-6.81%
Ranking of countries by current statistics by years