Download This statistics in other country:
Timeline:
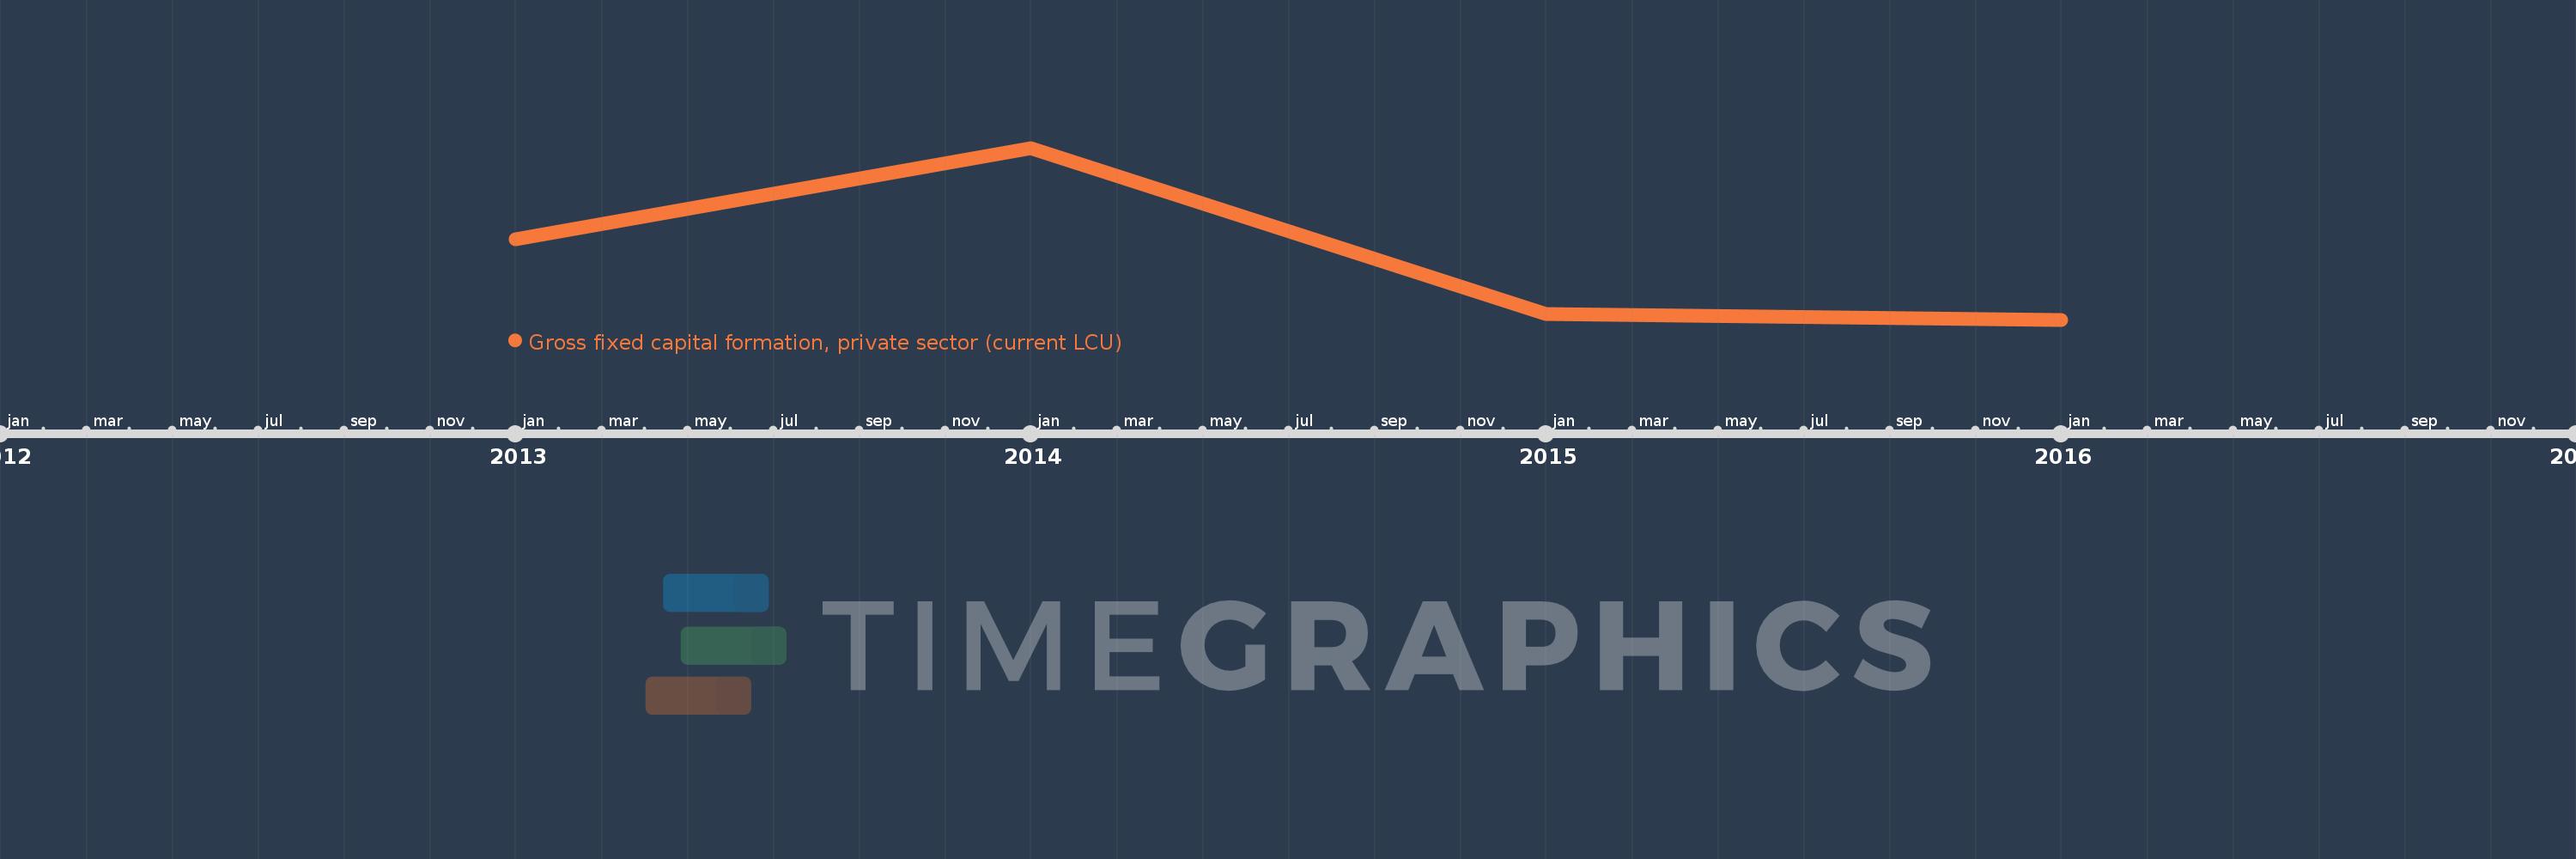
This timeline shows a graph from 2013 to 2016 of Iraq. No data until 2012. Number of actual observations by date: 4.
Source name:
World Development Indicators
Source organization:
World Bank national accounts data, and OECD National Accounts data files.
Categories, topics:
Economy & Growth
Last updated:
apr 23, 2017
Indicators value changes by year
Minimum:
19.53 trl
jan 1, 2016
Maximum:
25.992 trl
jan 1, 2014
At the date of observation
Value
Absolute change
Change from the previous value
jan 1, 2013
22.545 trl
+22.545 trl
0.0%
jan 1, 2014
25.992 trl
+3.447 trl
15.29%
jan 1, 2015
19.736 trl
-6.256 trl
-24.07%
jan 1, 2016
19.53 trl
-205.8 bln
-1.04%
Ranking of countries by current statistics by years