Download This statistics in other country:
Timeline:
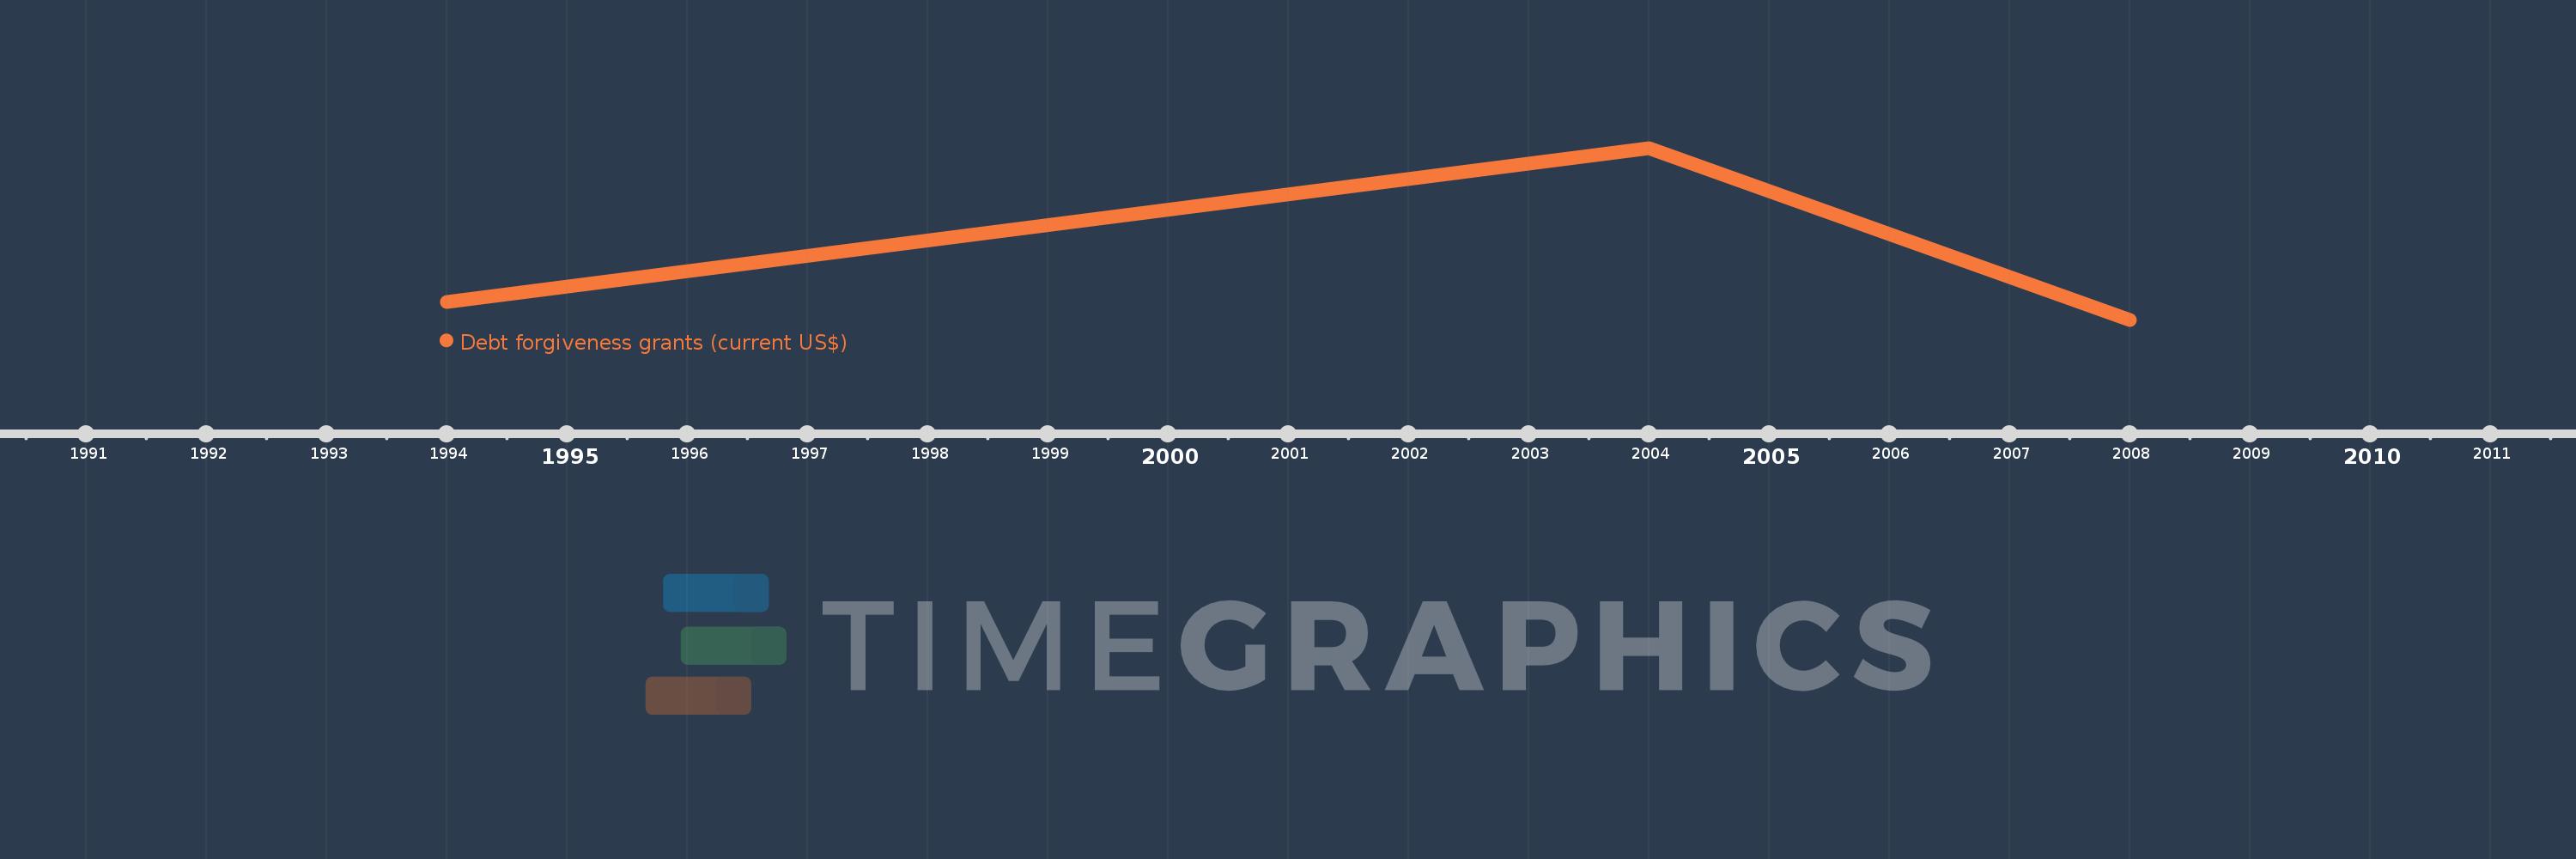
This timeline shows a graph from 1994 to 2008 of Argentina. No data until 1993. Number of actual observations by date: 3.
Source name:
World Development Indicators
Source organization:
Development Assistance Committee of the Organisation for Economic Co-operation and Development.
Categories, topics:
Aid Effectiveness, External Debt
Last updated:
apr 23, 2017
Indicators value changes by year
Minimum:
3.41 mln
jan 1, 2008
Maximum:
9.21 mln
jan 1, 2004
At the date of observation
Value
Absolute change
Change from the previous value
jan 1, 1994
4.0 mln
+4.0 mln
0.0%
jan 1, 2004
9.21 mln
+5.21 mln
130.25%
jan 1, 2008
3.41 mln
-5.8 mln
-62.98%
Ranking of countries by current statistics by years