33
/
AIzaSyB4mHJ5NPEv-XzF7P6NDYXjlkCWaeKw5bc
November 30, 2025
210207
Nicaragua
NIC
true
2
1
Debt forgiveness grants (current US$)
2014,2013,2012,2011,2010,2009,2008,2007,2006,2005,2004,2003,2002,2001,2000,1999,1998,1997,1996,1995,1994,1993,1992
Create a timeline
Public Timelines
For education
For educational institutions
For teachers
For students
Cabinet
For educational institutions
For teachers
For students
Open cabinet
FAQ
Close
Create a timeline
Public timelines
FAQ
About & Feedback
Terms
Privacy
FAQ
Support 24/7
Cabinet
Get premium
Donate
Download
Global statistics library
→
Nicaragua
→
Debt forgiveness grants (current US$)
This statistics in other country:
Afghanistan
Albania
Algeria
Angola
Argentina
Bangladesh
Belize
Benin
Bolivia
Bosnia and Herzegovina
Botswana
Bulgaria
Burkina Faso
Burundi
Cabo Verde
Cambodia
Cameroon
Central African Republic
Chad
Colombia
Comoros
Congo, Rep.
Costa Rica
Cote d'Ivoire
Djibouti
Dominica
Dominican Republic
East Asia & Pacific (excluding high income)
Ecuador
Egypt, Arab Rep.
El Salvador
Eritrea
Ethiopia
Europe & Central Asia (excluding high income)
Gabon
Gambia, The
Georgia
Ghana
Grenada
Guatemala
Guinea
Guinea-Bissau
Guyana
Haiti
Honduras
IDA only
India
Indonesia
Jamaica
Jordan
Kazakhstan
Kenya
Kyrgyz Republic
Lao PDR
Latin America & Caribbean (excluding high income)
Lebanon
Lesotho
Liberia
Low & middle income
Low income
Lower middle income
Macedonia, FYR
Madagascar
Malawi
Mali
Mauritania
Mauritius
Mexico
Middle East & North Africa (excluding high income)
Middle income
Mongolia
Montenegro
Morocco
Mozambique
Myanmar
Nepal
Nicaragua
Niger
Nigeria
Pakistan
Panama
Peru
Philippines
Rwanda
Samoa
Sao Tome and Principe
Senegal
Serbia
Sierra Leone
Solomon Islands
Somalia
South Asia
Sri Lanka
St. Lucia
St. Vincent and the Grenadines
Sub-Saharan Africa (excluding high income)
Sudan
Swaziland
Syrian Arab Republic
Tajikistan
Tanzania
Thailand
Togo
Tunisia
Uganda
Upper middle income
Vanuatu
Vietnam
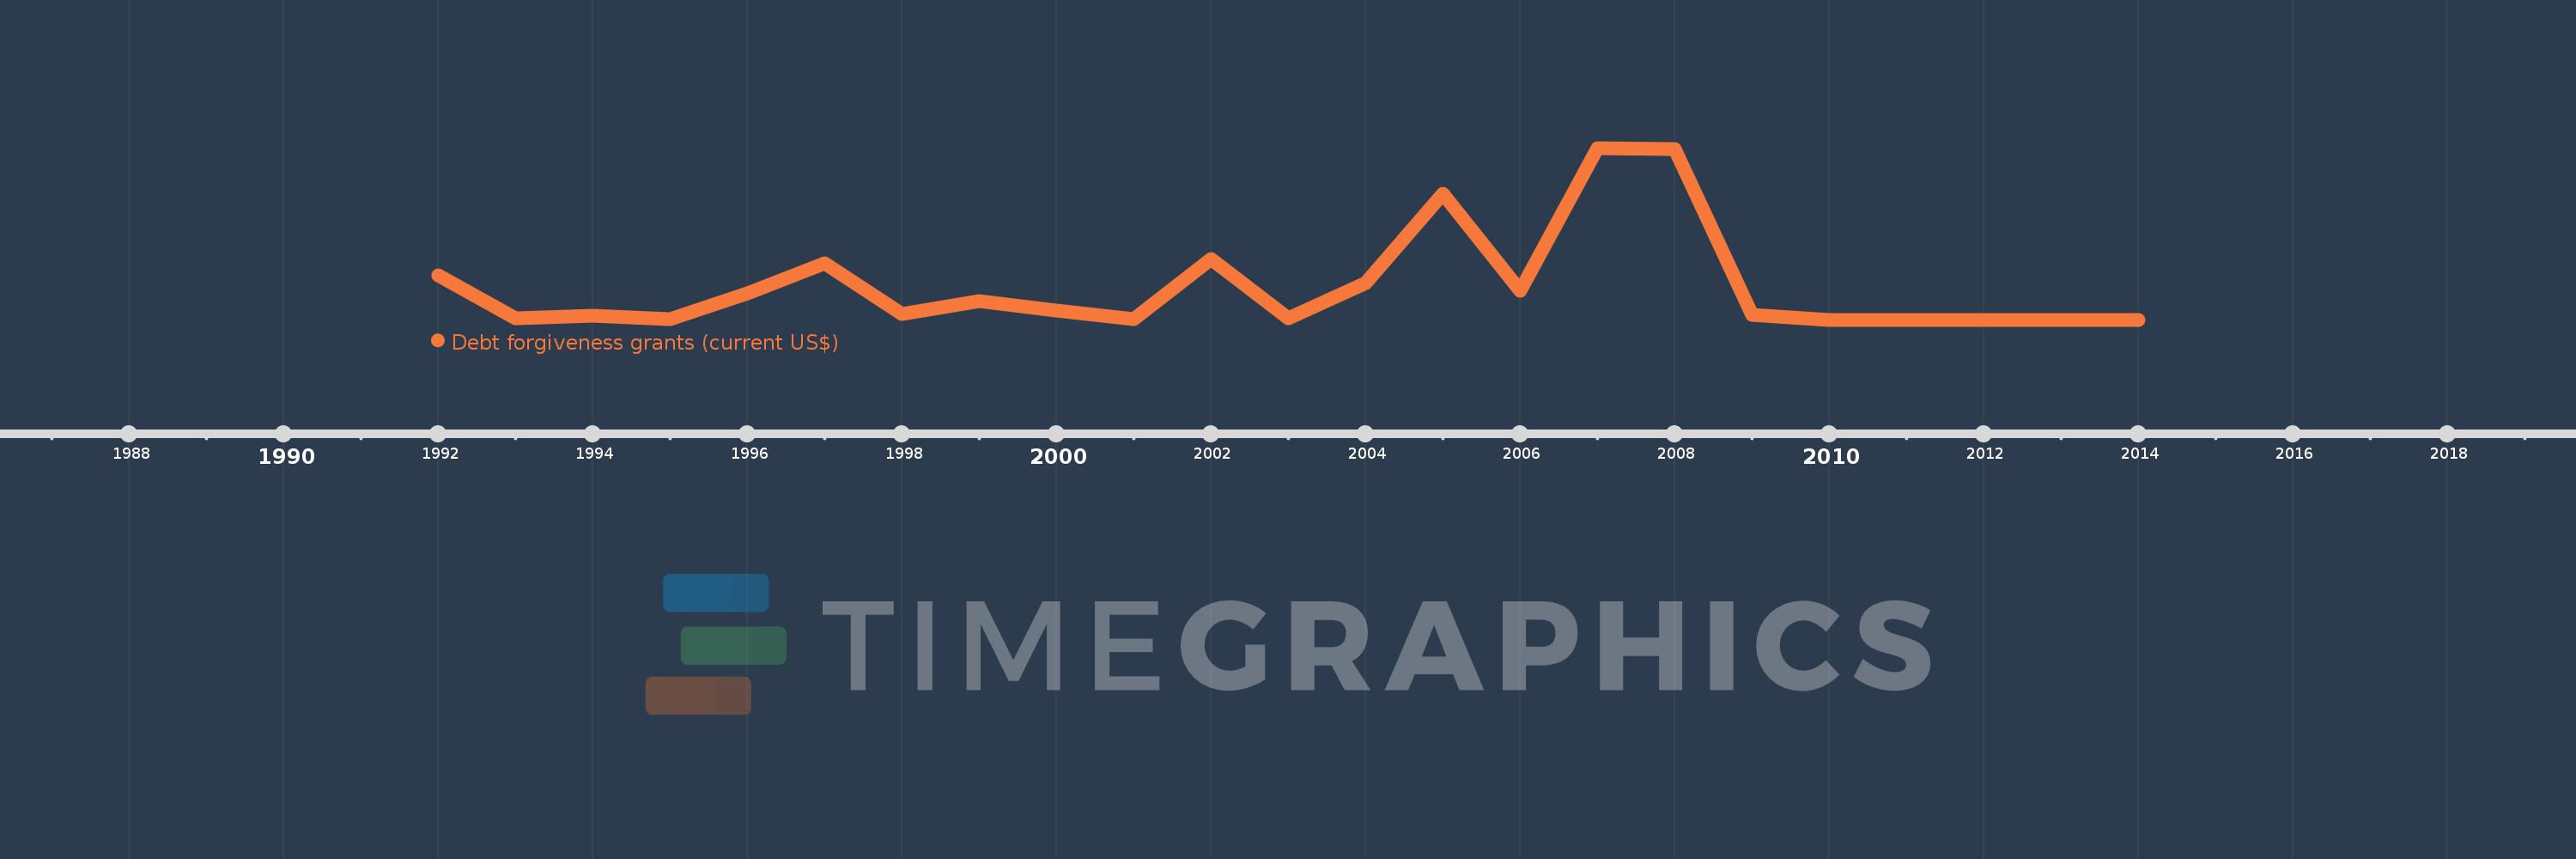
Timeline:
This timeline shows a graph from
1992
to
2014
of Nicaragua. No data until
1991
. Number of actual observations by date:
23
.
Source name:
World Development Indicators
Source organization:
Development Assistance Committee of the Organisation for Economic Co-operation and Development.
Categories, topics:
Aid Effectiveness, External Debt
Last updated:
apr 23, 2017
Indicators value changes by year
Meaning:
230.817 mln
Minimum:
520.0K
jan 1, 2010
Maximum:
1.182 bln
jan 1, 2007
At the date of observation
Value
Absolute change
Change from the previous value
jan 1, 1992
303.14 mln
+303.14 mln
0.0%
jan 1, 1993
13.32 mln
-289.82 mln
-95.61%
jan 1, 1994
29.82 mln
+16.5 mln
123.87%
jan 1, 1995
7.33 mln
-22.49 mln
-75.42%
jan 1, 1996
181.52 mln
+174.19 mln
2.38K%
jan 1, 1997
390.37 mln
+208.85 mln
115.06%
jan 1, 1998
40.2 mln
-350.17 mln
-89.7%
jan 1, 1999
129.01 mln
+88.81 mln
220.92%
jan 1, 2000
64.52 mln
-64.49 mln
-49.99%
jan 1, 2001
7.44 mln
-57.08 mln
-88.47%
jan 1, 2002
417.04 mln
+409.6 mln
5.51K%
jan 1, 2003
9.08 mln
-407.96 mln
-97.82%
jan 1, 2004
253.65 mln
+244.57 mln
2.69K%
jan 1, 2005
870.08 mln
+616.43 mln
243.02%
jan 1, 2006
198.77 mln
-671.31 mln
-77.15%
jan 1, 2007
1.182 bln
+983.5 mln
494.79%
jan 1, 2008
1.174 bln
-7.97 mln
-0.67%
jan 1, 2009
33.4 mln
-1.141 bln
-97.16%
jan 1, 2010
520.0K
-32.88 mln
-98.44%
jan 1, 2011
720.0K
+200.0K
38.46%
jan 1, 2012
610.0K
-110.0K
-15.28%
jan 1, 2013
830.0K
+220.0K
36.07%
jan 1, 2014
860.0K
+30.0K
3.61%
Ranking of countries by current statistics by years
About & Feedback
Terms
Privacy
FAQ
Support 24/7
Cabinet
Get premium
Donate
The service accepts bank transfer (ACH, Wire) or cards (Visa, MasterCard, etc). Processed by Stripe.
Secured with SSL