Download This statistics in other country:
Timeline:
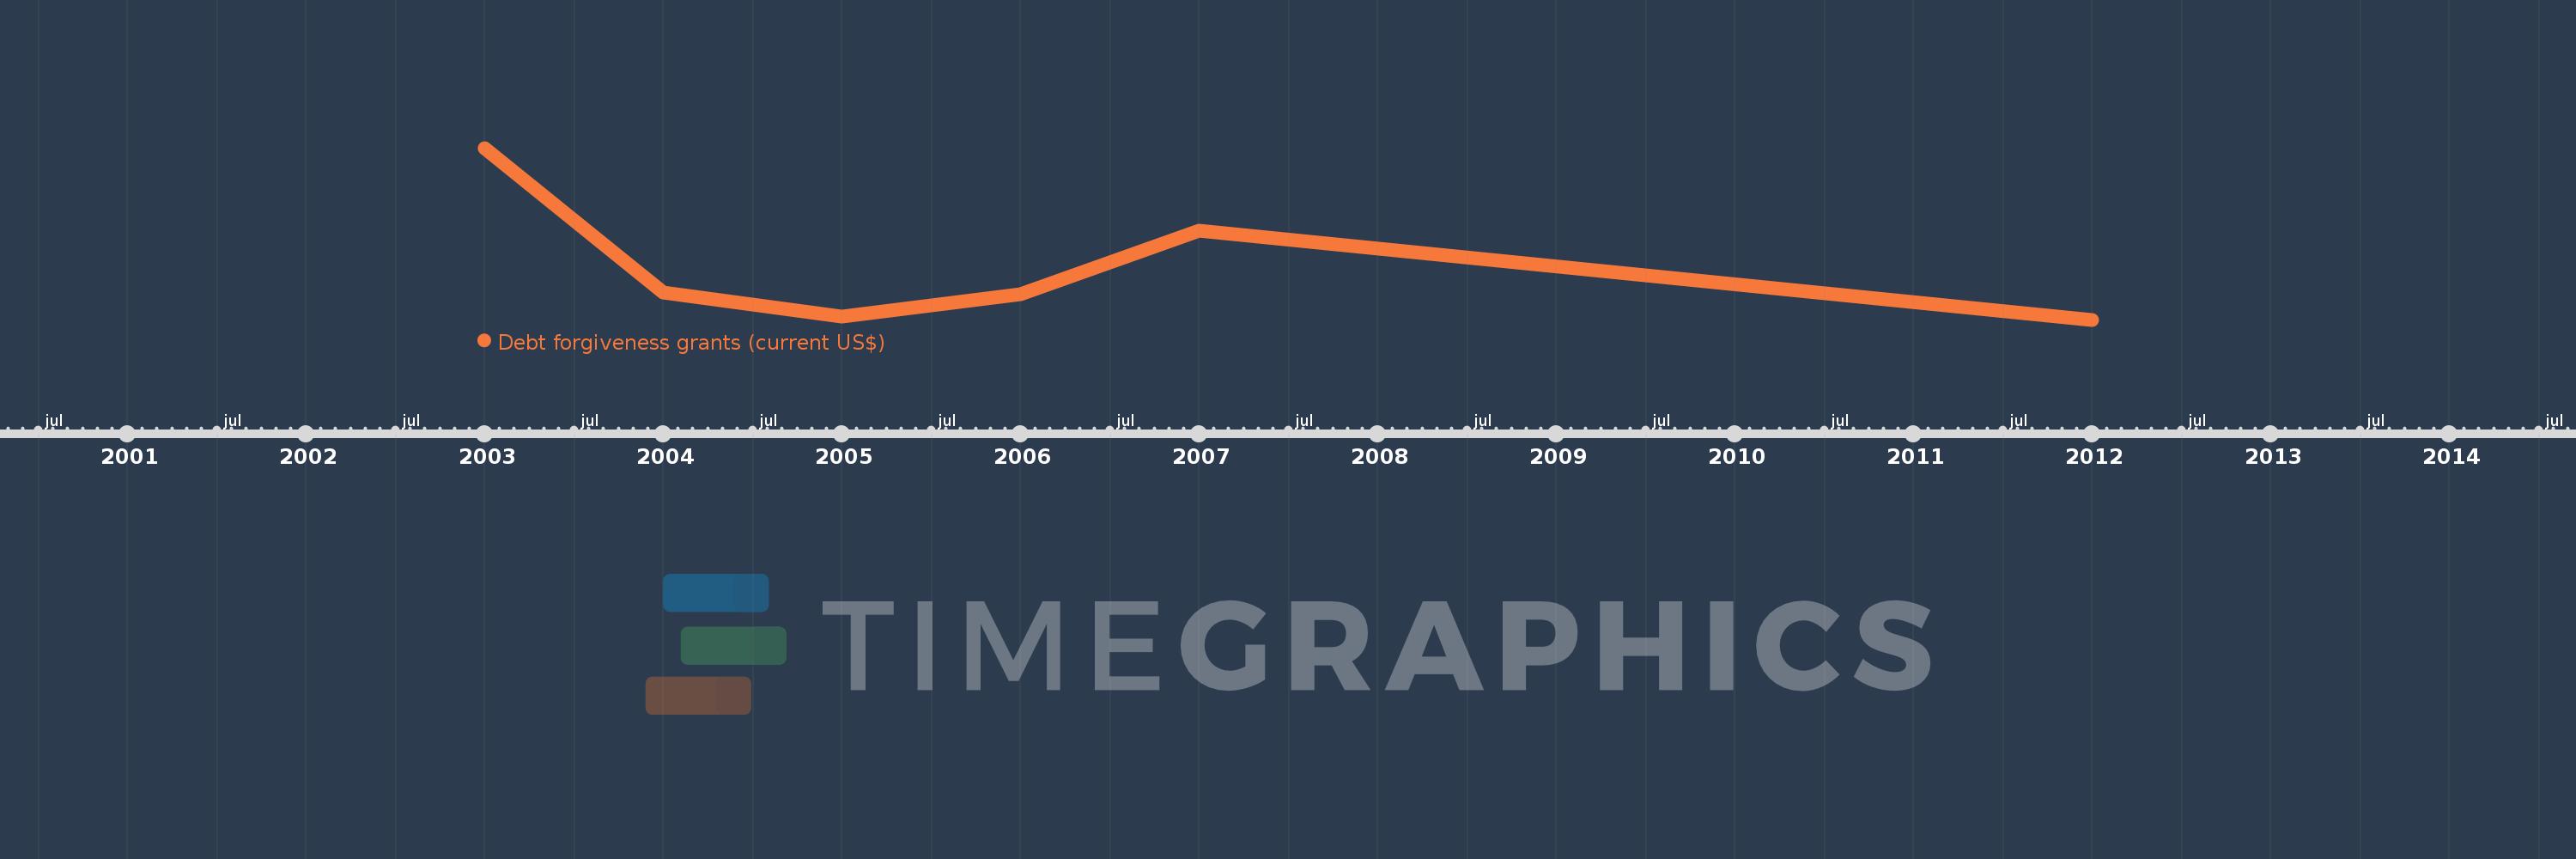
This timeline shows a graph from 2003 to 2012 of Serbia. No data until 2002. Number of actual observations by date: 6.
Source name:
World Development Indicators
Source organization:
Development Assistance Committee of the Organisation for Economic Co-operation and Development.
Categories, topics:
Aid Effectiveness, External Debt
Last updated:
apr 23, 2017
Indicators value changes by year
Minimum:
4.27 mln
jan 1, 2012
Maximum:
1.326 bln
jan 1, 2003
At the date of observation
Value
Absolute change
Change from the previous value
jan 1, 2003
1.326 bln
+1.326 bln
0.0%
jan 1, 2004
215.68 mln
-1.11 bln
-83.74%
jan 1, 2005
31.17 mln
-184.51 mln
-85.55%
jan 1, 2006
200.91 mln
+169.74 mln
544.56%
jan 1, 2007
689.12 mln
+488.21 mln
243.0%
jan 1, 2012
4.27 mln
-684.85 mln
-99.38%
Ranking of countries by current statistics by years