Download This statistics in other country:
Timeline:
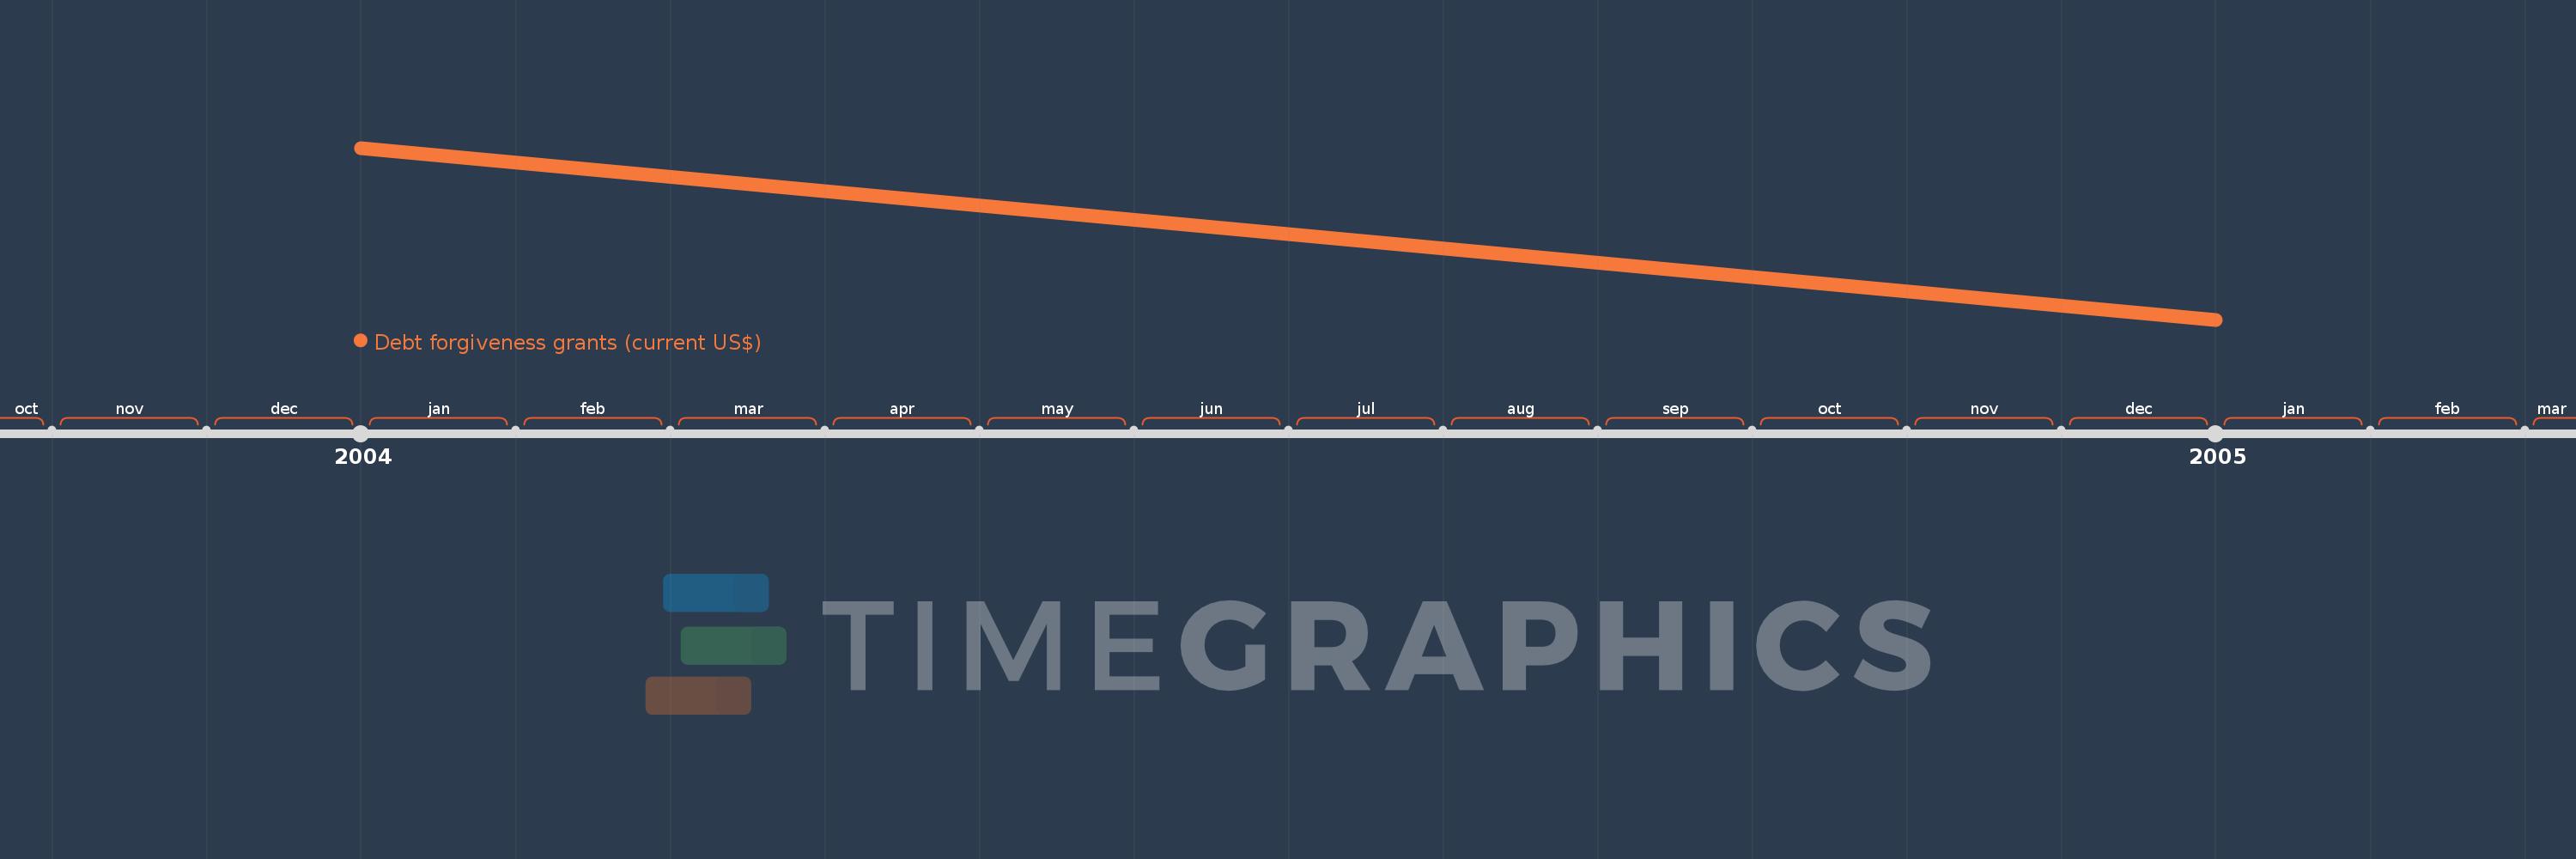
This timeline shows a graph from 2004 to 2005 of Panama. No data until 2003. Number of actual observations by date: 2.
Source name:
World Development Indicators
Source organization:
Development Assistance Committee of the Organisation for Economic Co-operation and Development.
Categories, topics:
Aid Effectiveness, External Debt
Last updated:
apr 23, 2017
Indicators value changes by year
Minimum:
150.0K
jan 1, 2005
Maximum:
7.63 mln
jan 1, 2004
At the date of observation
Value
Absolute change
Change from the previous value
jan 1, 2004
7.63 mln
+7.63 mln
0.0%
jan 1, 2005
150.0K
-7.48 mln
-98.03%
Ranking of countries by current statistics by years