Download This statistics in other country:
Timeline:
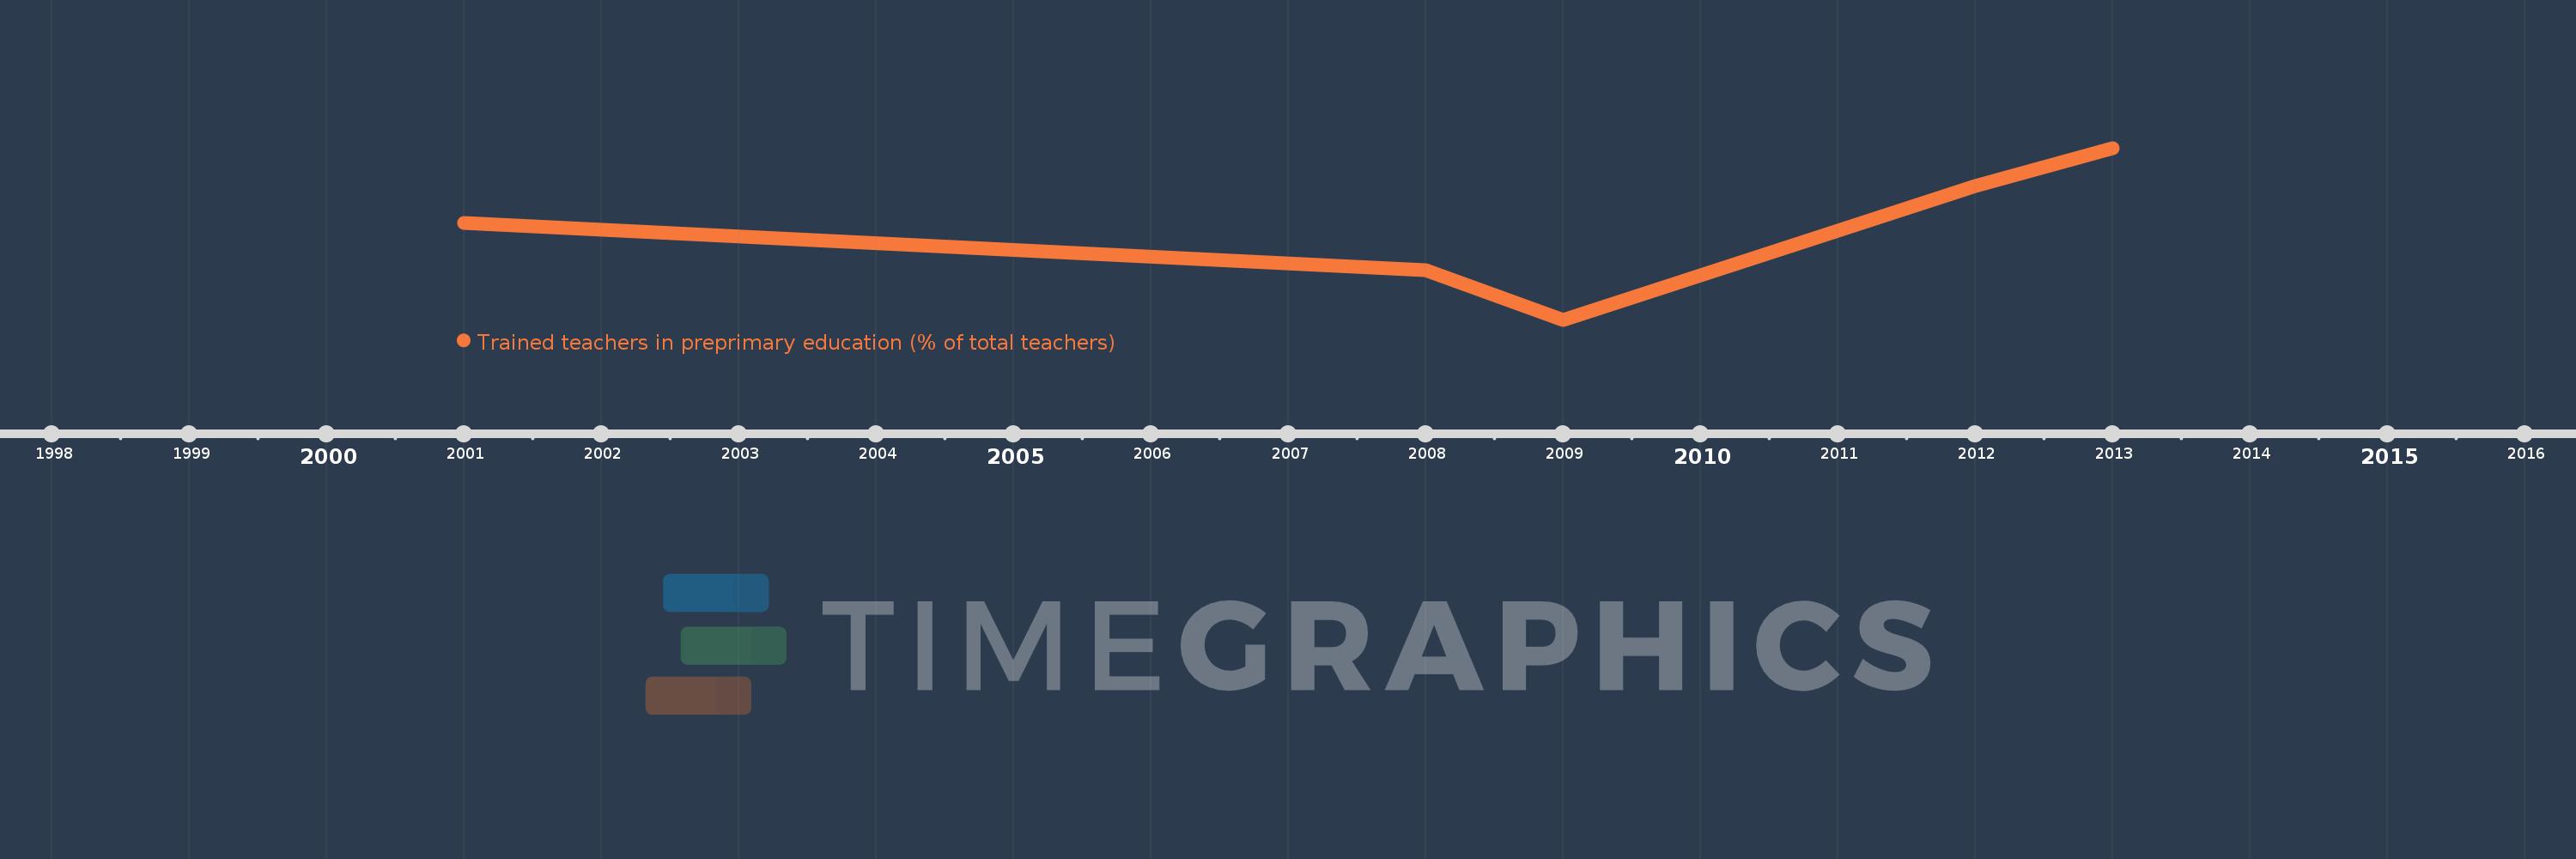
This timeline shows a graph from 2001 to 2013 of Antigua and Barbuda. No data until 2000. Number of actual observations by date: 5.
Source name:
World Development Indicators
Source organization:
United Nations Educational, Scientific, and Cultural Organization (UNESCO) Institute for Statistics.
Categories, topics:
Education
Last updated:
apr 23, 2017
Indicators value changes by year
Minimum:
11.962
jan 1, 2009
Maximum:
70.968
jan 1, 2013
At the date of observation
Value
Absolute change
Change from the previous value
jan 1, 2001
45.076
+45.076
0.0%
jan 1, 2008
28.889
-16.187
-35.91%
jan 1, 2009
11.962
-16.927
-58.59%
jan 1, 2012
58.042
+46.08
385.23%
jan 1, 2013
70.968
+12.926
22.27%
Ranking of countries by current statistics by years