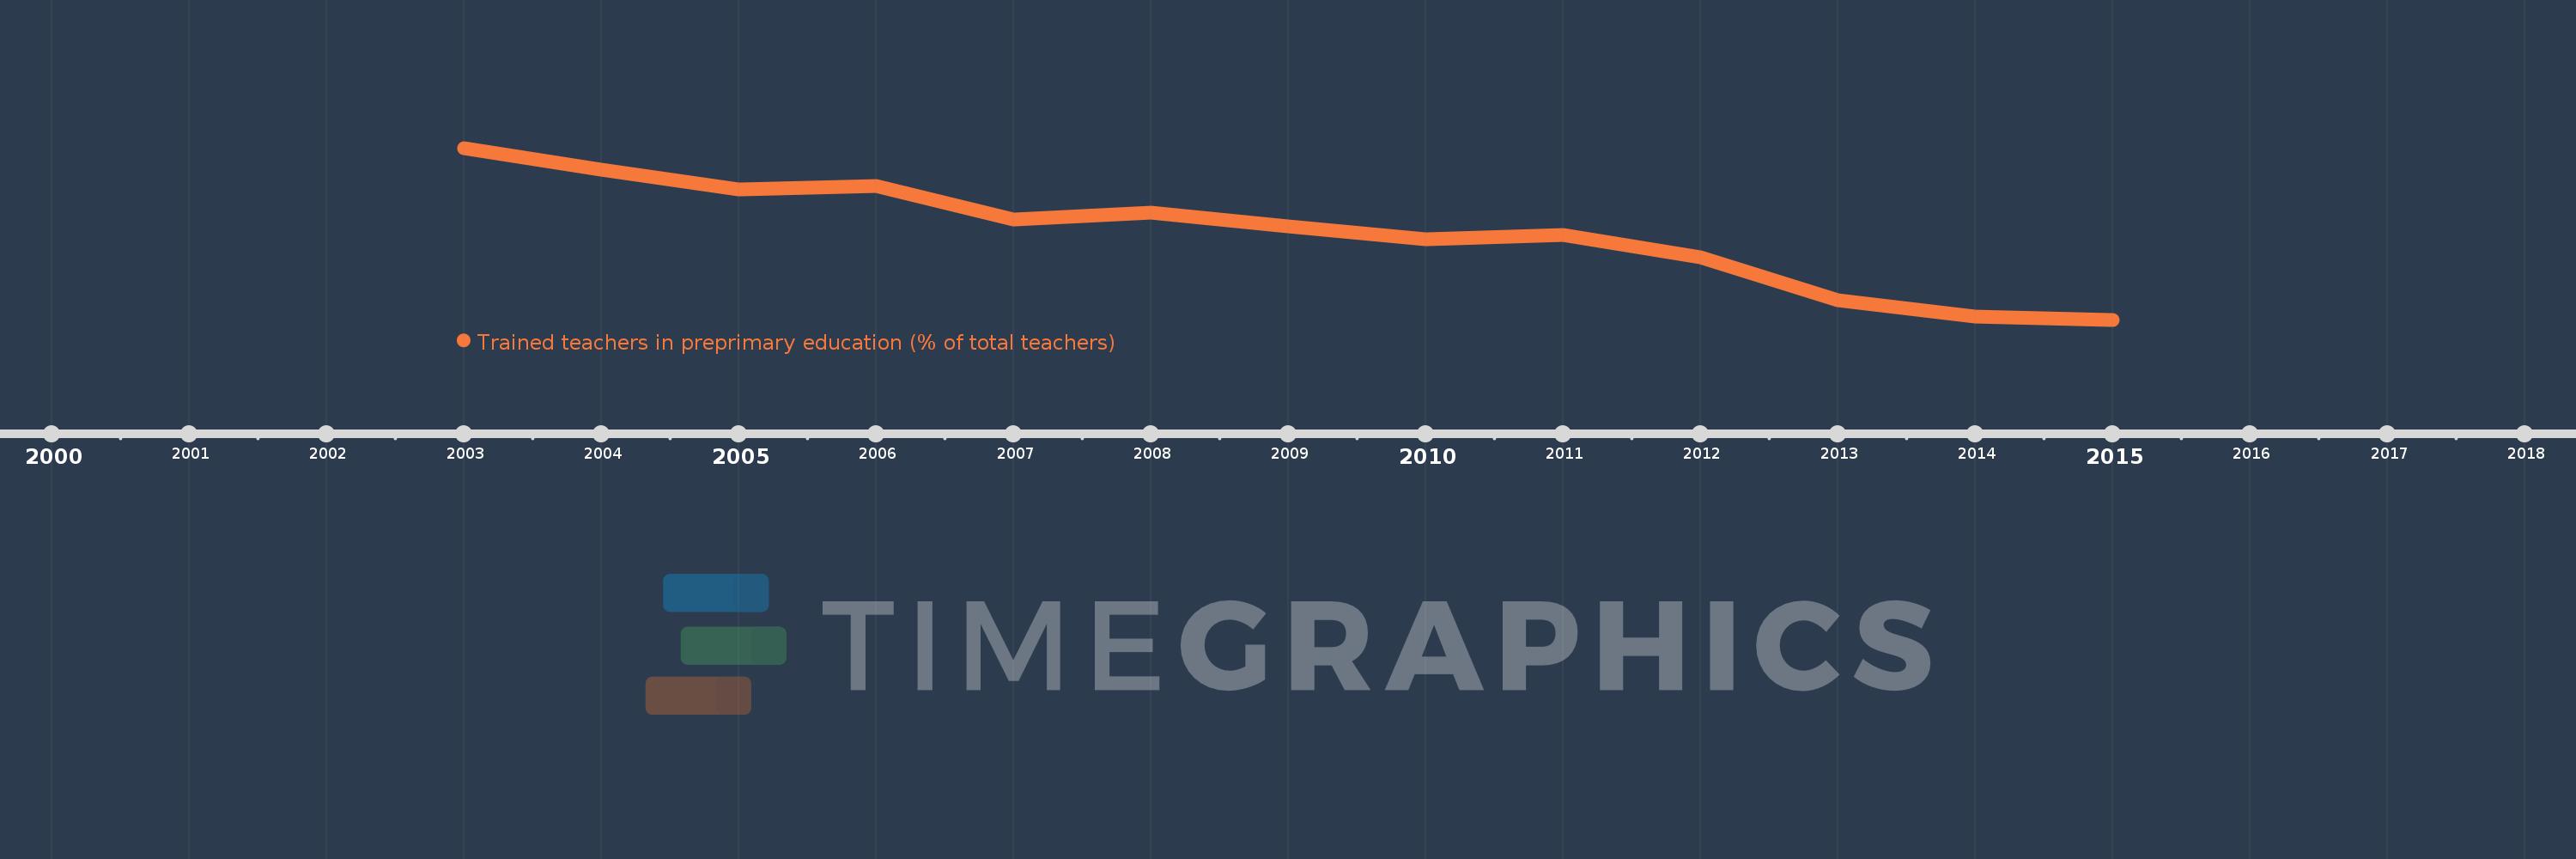
This timeline shows a graph from 2003 to 2015 of Heavily indebted poor countries (HIPC). No data until 2002. Number of actual observations by date: 13.
Source name:
World Development Indicators
Source organization:
United Nations Educational, Scientific, and Cultural Organization (UNESCO) Institute for Statistics.
Categories, topics:
Education
Last updated:
apr 23, 2017
Indicators value changes by year
Meaning:
51.637
Minimum:
39.137
jan 1, 2015
Maximum:
63.711
jan 1, 2003
At the date of observation
Value
Absolute change
Change from the previous value
jan 1, 2003
63.711
+63.711
0.0%
jan 1, 2004
60.595
-3.115
-4.89%
jan 1, 2005
57.771
-2.824
-4.66%
jan 1, 2006
58.298
+0.527
0.91%
jan 1, 2007
53.483
-4.816
-8.26%
jan 1, 2008
54.422
+0.94
1.76%
jan 1, 2009
52.459
-1.963
-3.61%
jan 1, 2010
50.599
-1.86
-3.55%
jan 1, 2011
51.253
+0.653
1.29%
jan 1, 2012
48.049
-3.203
-6.25%
jan 1, 2013
41.89
-6.159
-12.82%
jan 1, 2014
39.618
-2.272
-5.42%
jan 1, 2015
39.137
-0.482
-1.22%
Ranking of countries by current statistics by years