33
/
AIzaSyAYiBZKx7MnpbEhh9jyipgxe19OcubqV5w
August 1, 2025
43094
Latin America & Caribbean (excluding high income)
LAC
false
2
1
Trained teachers in preprimary education (% of total teachers)
2012,2011,2010,2009,2008,2007
Download
Global statistics library →Latin America & Caribbean (excluding high income) →

Trained teachers in preprimary education (% of total teachers)

This statistics in other country:

AndorraAngolaAntigua and BarbudaArab WorldArmeniaArubaAzerbaijanBahamas, TheBahrainBarbadosBelarusBelizeBeninBermudaBhutanBoliviaBotswanaBritish Virgin IslandsBrunei DarussalamBurkina FasoBurundiCabo VerdeCambodiaCameroonCaribbean small statesCayman IslandsChadColombiaCongo, Dem. Rep.Congo, Rep.Costa RicaCote d'IvoireCroatiaCubaDjiboutiDominicaDominican RepublicEcuadorEgypt, Arab Rep.El SalvadorEritreaEthiopiaFragile and conflict affected situationsGambia, TheGeorgiaGhanaGibraltarGrenadaGuineaGuinea-BissauGuyanaHeavily indebted poor countries (HIPC)HondurasIDA blendIDA onlyIDA totalIran, Islamic Rep.IraqKazakhstanKenyaKuwaitKyrgyz RepublicLao PDRLatin America & Caribbean Latin America & Caribbean (excluding high income)Latin America & the Caribbean (IDA & IBRD countries)Least developed countries: UN classificationLebanonLiberiaLow incomeMacao SAR, ChinaMadagascarMalaysiaMaldivesMaliMarshall IslandsMauritaniaMauritiusMexicoMiddle East & North AfricaMiddle East & North Africa (excluding high income)Middle East & North Africa (IDA & IBRD countries)MoldovaMongoliaMoroccoMyanmarNamibiaNauruNepalNicaraguaNigerOmanOther small statesPacific island small statesPanamaParaguayPre-demographic dividendQatarRwandaSamoaSao Tome and PrincipeSaudi ArabiaSenegalSerbiaSeychellesSierra LeoneSmall statesSolomon IslandsSouth AfricaSouth SudanSt. Kitts and NevisSt. LuciaSt. Vincent and the GrenadinesSub-Saharan Africa Sub-Saharan Africa (excluding high income)Sub-Saharan Africa (IDA & IBRD countries)SurinameSwazilandSyrian Arab RepublicTajikistanTanzaniaTogoTongaTrinidad and TobagoTunisiaTuvaluUnited Arab EmiratesUzbekistanVanuatuVietnamWest Bank and GazaZimbabwe

Timeline:

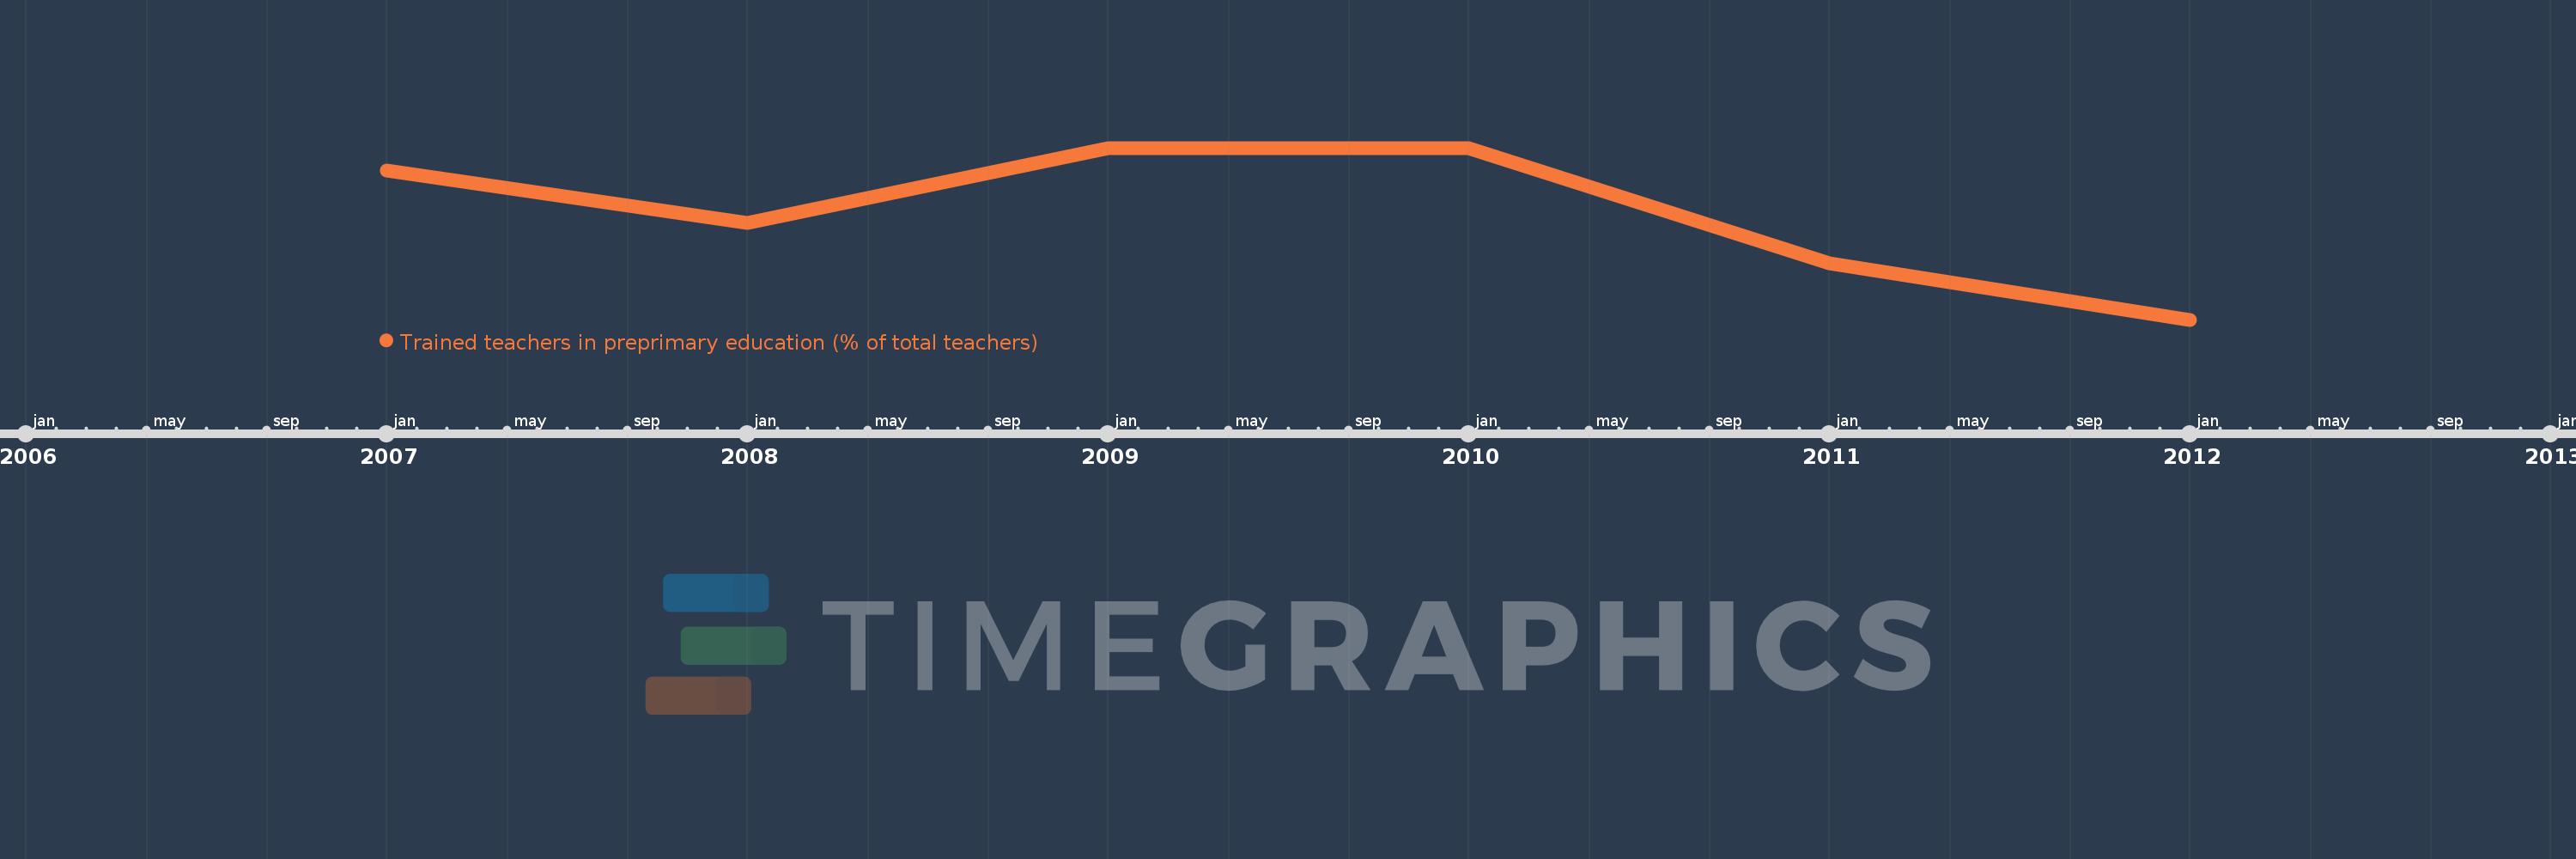
This timeline shows a graph from 2007 to 2012 of Latin America & Caribbean (excluding high income). No data until 2006. Number of actual observations by date: 6.

Source name:

World Development Indicators

Source organization:

United Nations Educational, Scientific, and Cultural Organization (UNESCO) Institute for Statistics.

Categories, topics:

Education

Last updated:

apr 23, 2017

Indicators value changes by year

Meaning:
79.242
Minimum:
78.315
jan 1, 2012
Maximum:
79.796
jan 1, 2009
At the date of observation
Value
Absolute change
Change from the previous value
jan 1, 2007
79.599
+79.599
0.0%
jan 1, 2008
79.148
-0.451
-0.57%
jan 1, 2009
79.796
+0.648
0.82%
jan 1, 2010
79.791
-0.005
-0.01%
jan 1, 2011
78.802
-0.989
-1.24%
jan 1, 2012
78.315
-0.488
-0.62%

Ranking of countries by current statistics by years