Download This statistics in other country:
Timeline:
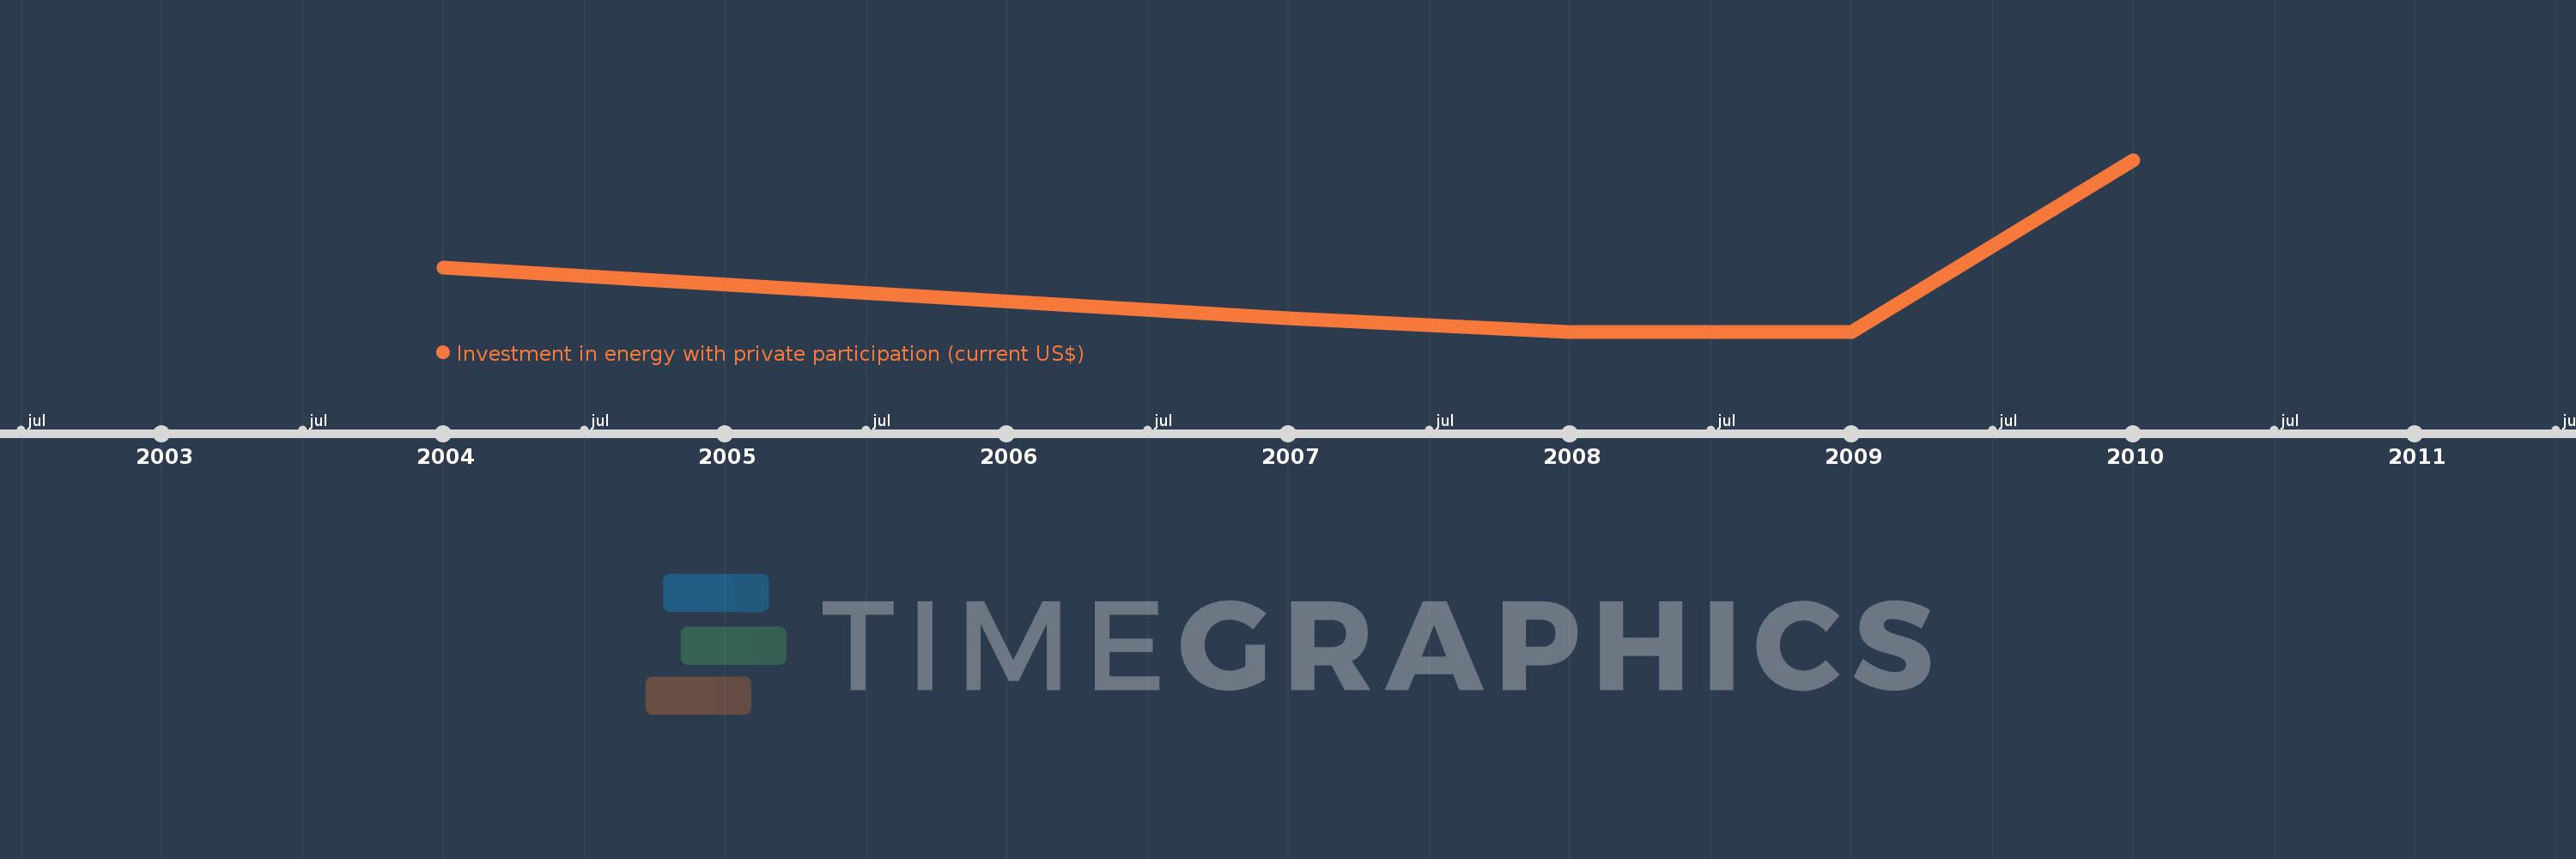
This timeline shows a graph from 2004 to 2010 of Angola. No data until 2003. Number of actual observations by date: 5.
Source name:
World Development Indicators
Source organization:
World Bank, Private Participation in Infrastructure Project Database (http://ppi.worldbank.org).
Categories, topics:
Energy & Mining, Infrastructure, Private Sector
Last updated:
apr 23, 2017
Indicators value changes by year
Maximum:
120.0 mln
jan 1, 2010
At the date of observation
Value
Absolute change
Change from the previous value
jan 1, 2004
45.0 mln
+45.0 mln
0.0%
jan 1, 2007
9.4 mln
-35.6 mln
-79.11%
jan 1, 2008
0.0
-9.4 mln
-100.0%
jan 1, 2010
120.0 mln
+120.0 mln
%
Ranking of countries by current statistics by years