33
/
AIzaSyB4mHJ5NPEv-XzF7P6NDYXjlkCWaeKw5bc
November 30, 2025
223762
Philippines
PHL
true
2
1
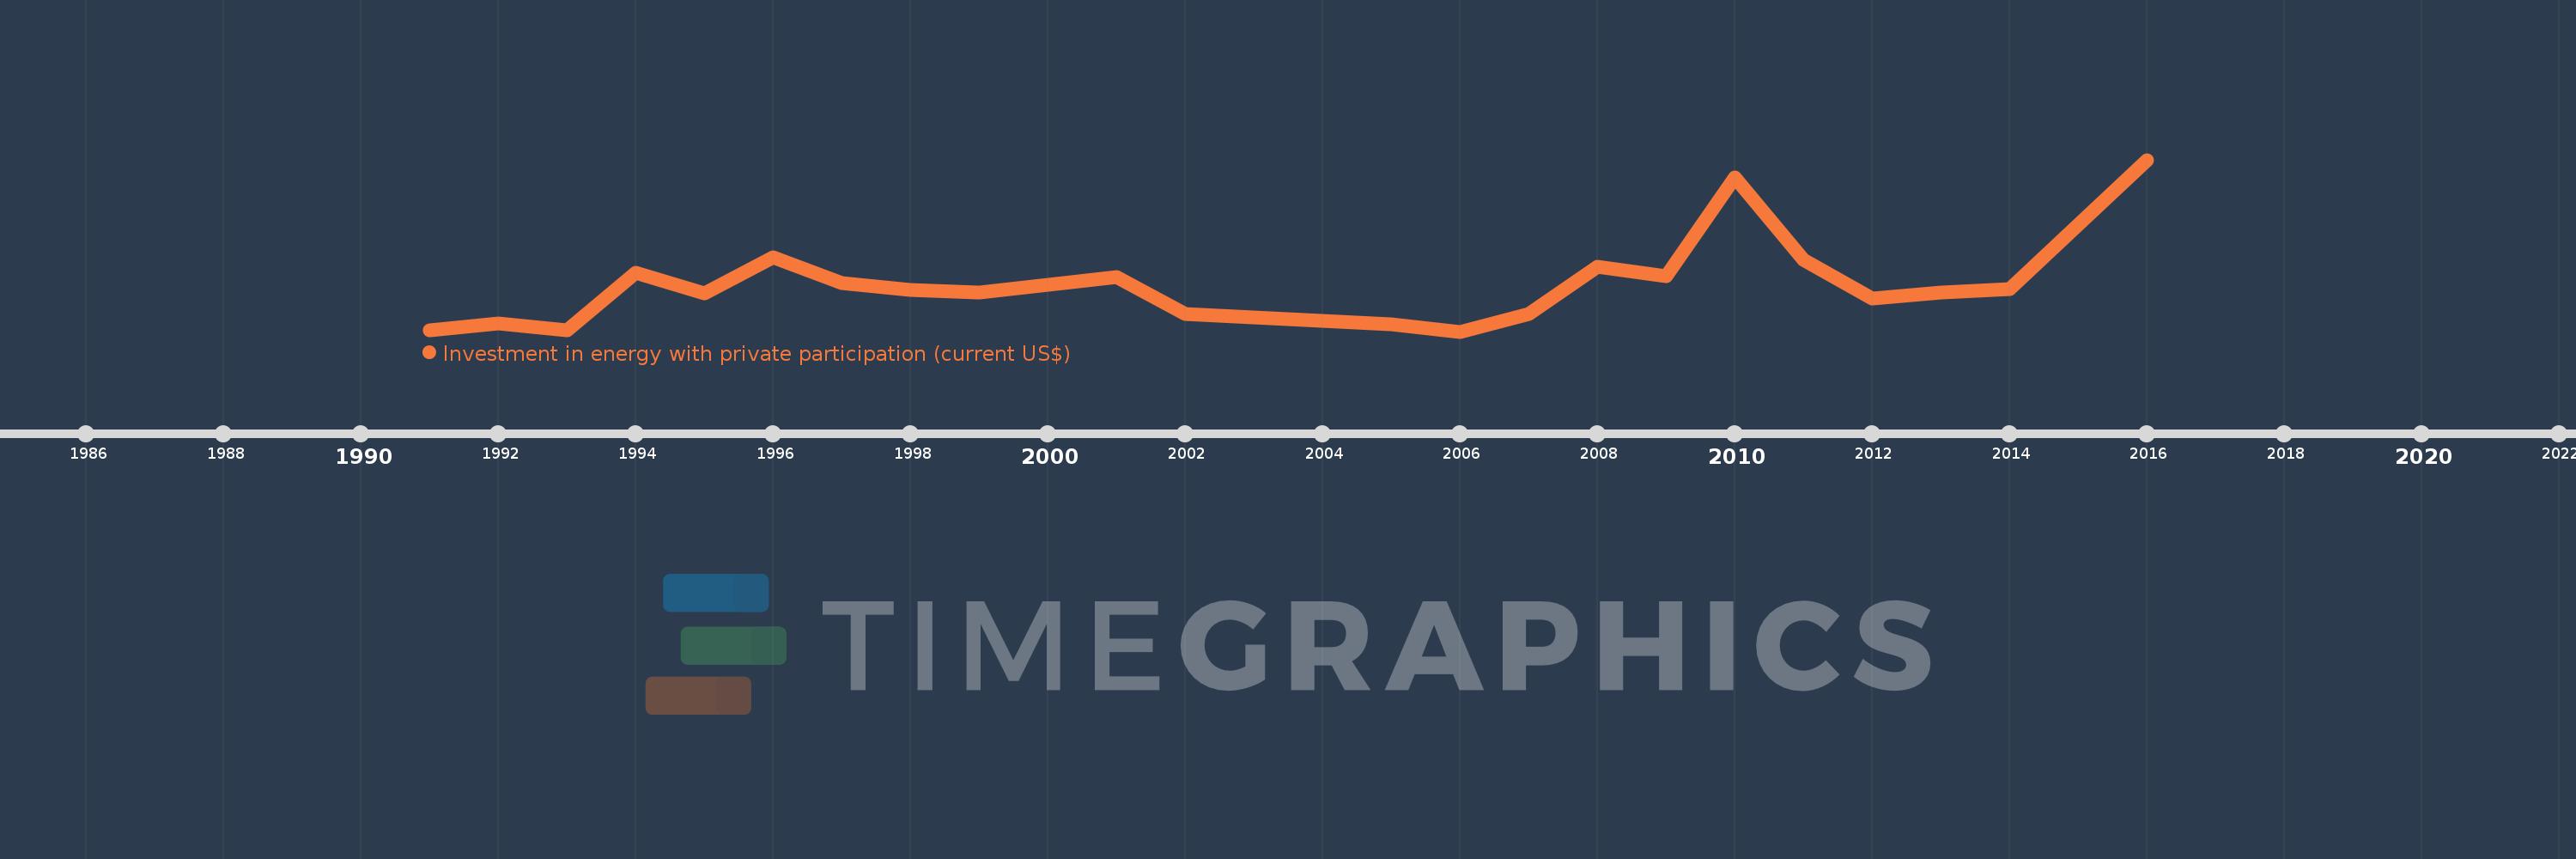
Investment in energy with private participation (current US$)
2016,2014,2013,2012,2011,2010,2009,2008,2007,2006,2005,2004,2002,2001,1999,1998,1997,1996,1995,1994,1993,1992,1991