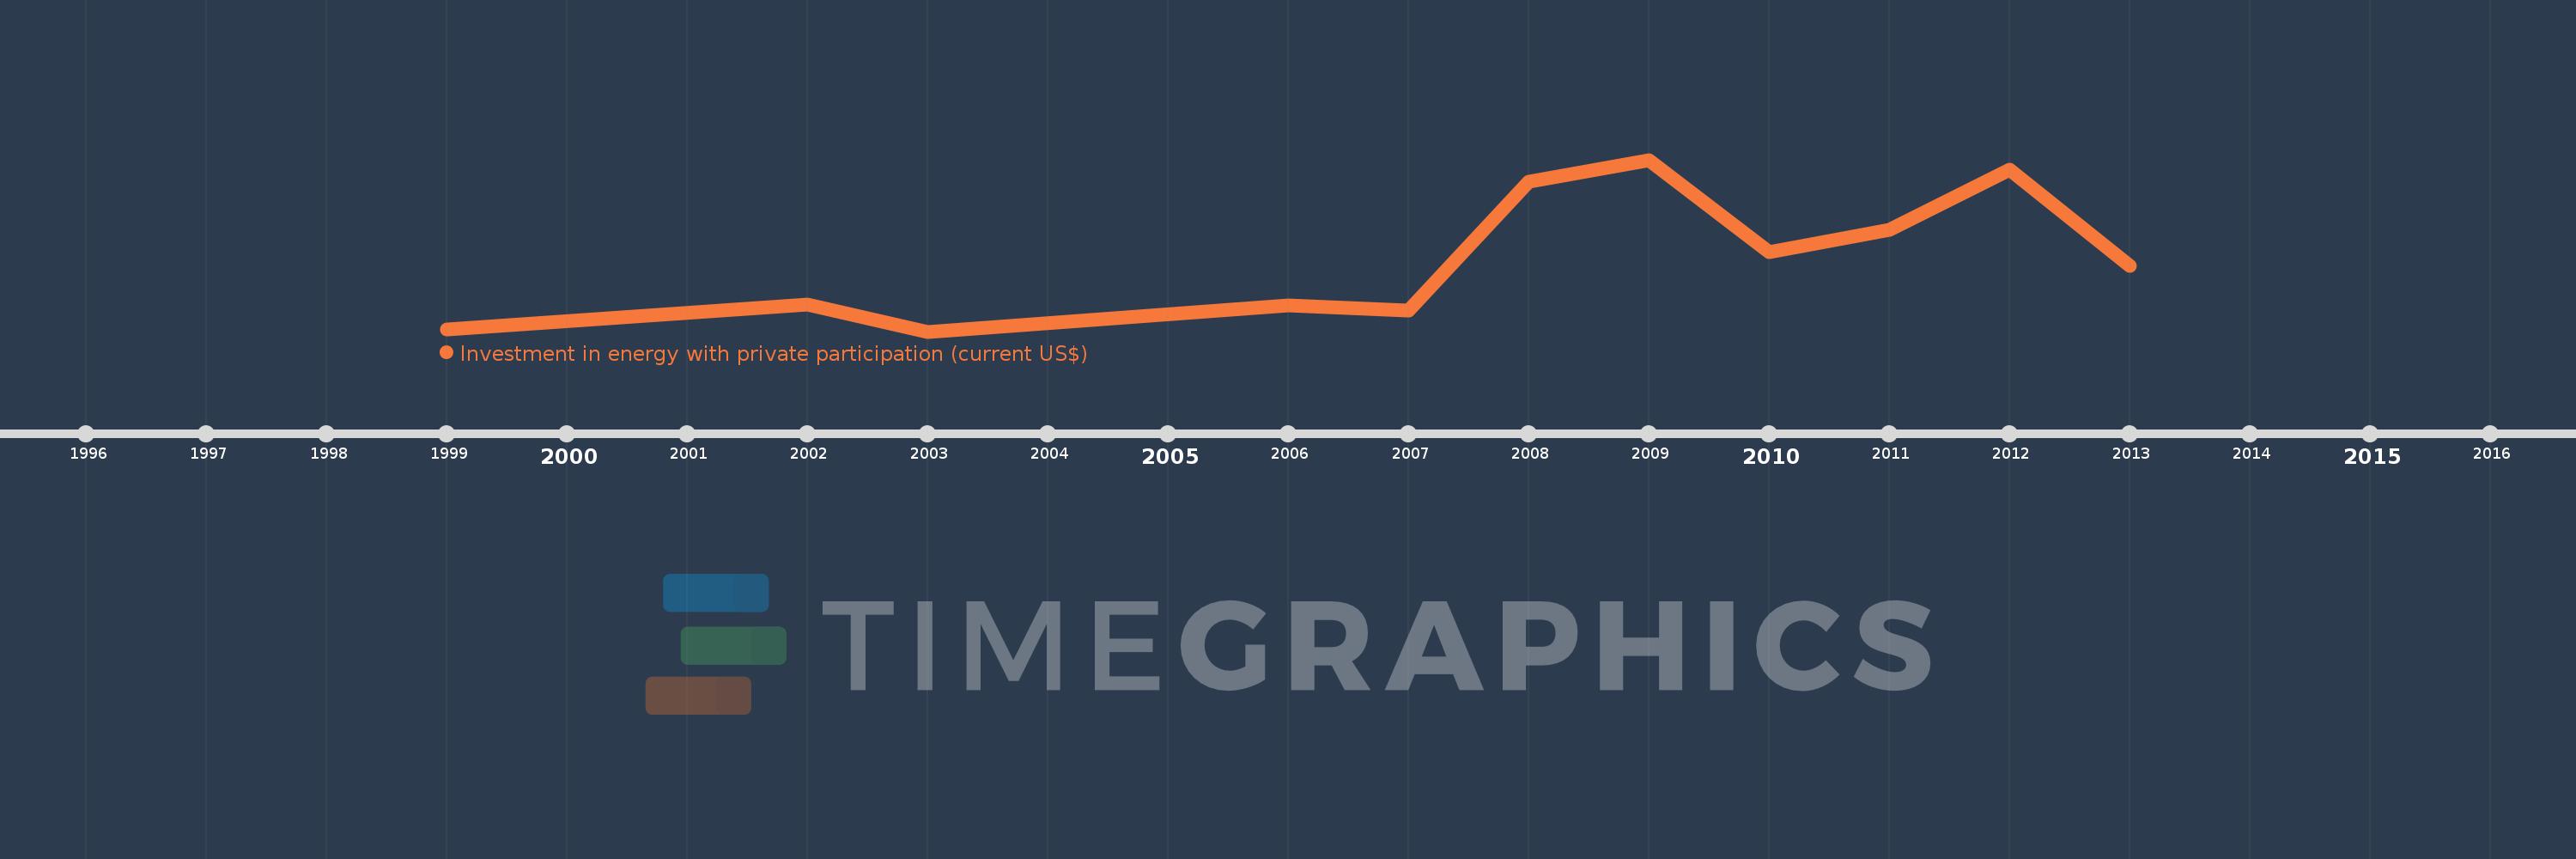
This timeline shows a graph from 1999 to 2013 of Europe & Central Asia (excluding high income). No data until 1998. Number of actual observations by date: 11.
Source name:
World Development Indicators
Source organization:
World Bank, Private Participation in Infrastructure Project Database (http://ppi.worldbank.org).
Categories, topics:
Energy & Mining, Infrastructure, Private Sector
Last updated:
apr 23, 2017
Indicators value changes by year
Meaning:
9.201 bln
Minimum:
612.2 mln
jan 1, 2003
Maximum:
20.747 bln
jan 1, 2009
At the date of observation
Value
Absolute change
Change from the previous value
jan 1, 1999
879.0 mln
+879.0 mln
0.0%
jan 1, 2002
3.79 bln
+2.911 bln
331.17%
jan 1, 2003
612.2 mln
-3.178 bln
-83.85%
jan 1, 2006
3.647 bln
+3.034 bln
495.66%
jan 1, 2007
3.096 bln
-551.1 mln
-15.11%
jan 1, 2008
18.169 bln
+15.074 bln
486.95%
jan 1, 2009
20.747 bln
+2.578 bln
14.19%
jan 1, 2010
9.881 bln
-10.866 bln
-52.37%
jan 1, 2011
12.504 bln
+2.623 bln
26.54%
jan 1, 2012
19.614 bln
+7.11 bln
56.86%
jan 1, 2013
8.274 bln
-11.34 bln
-57.82%
Ranking of countries by current statistics by years