Download This statistics in other country:
Timeline:
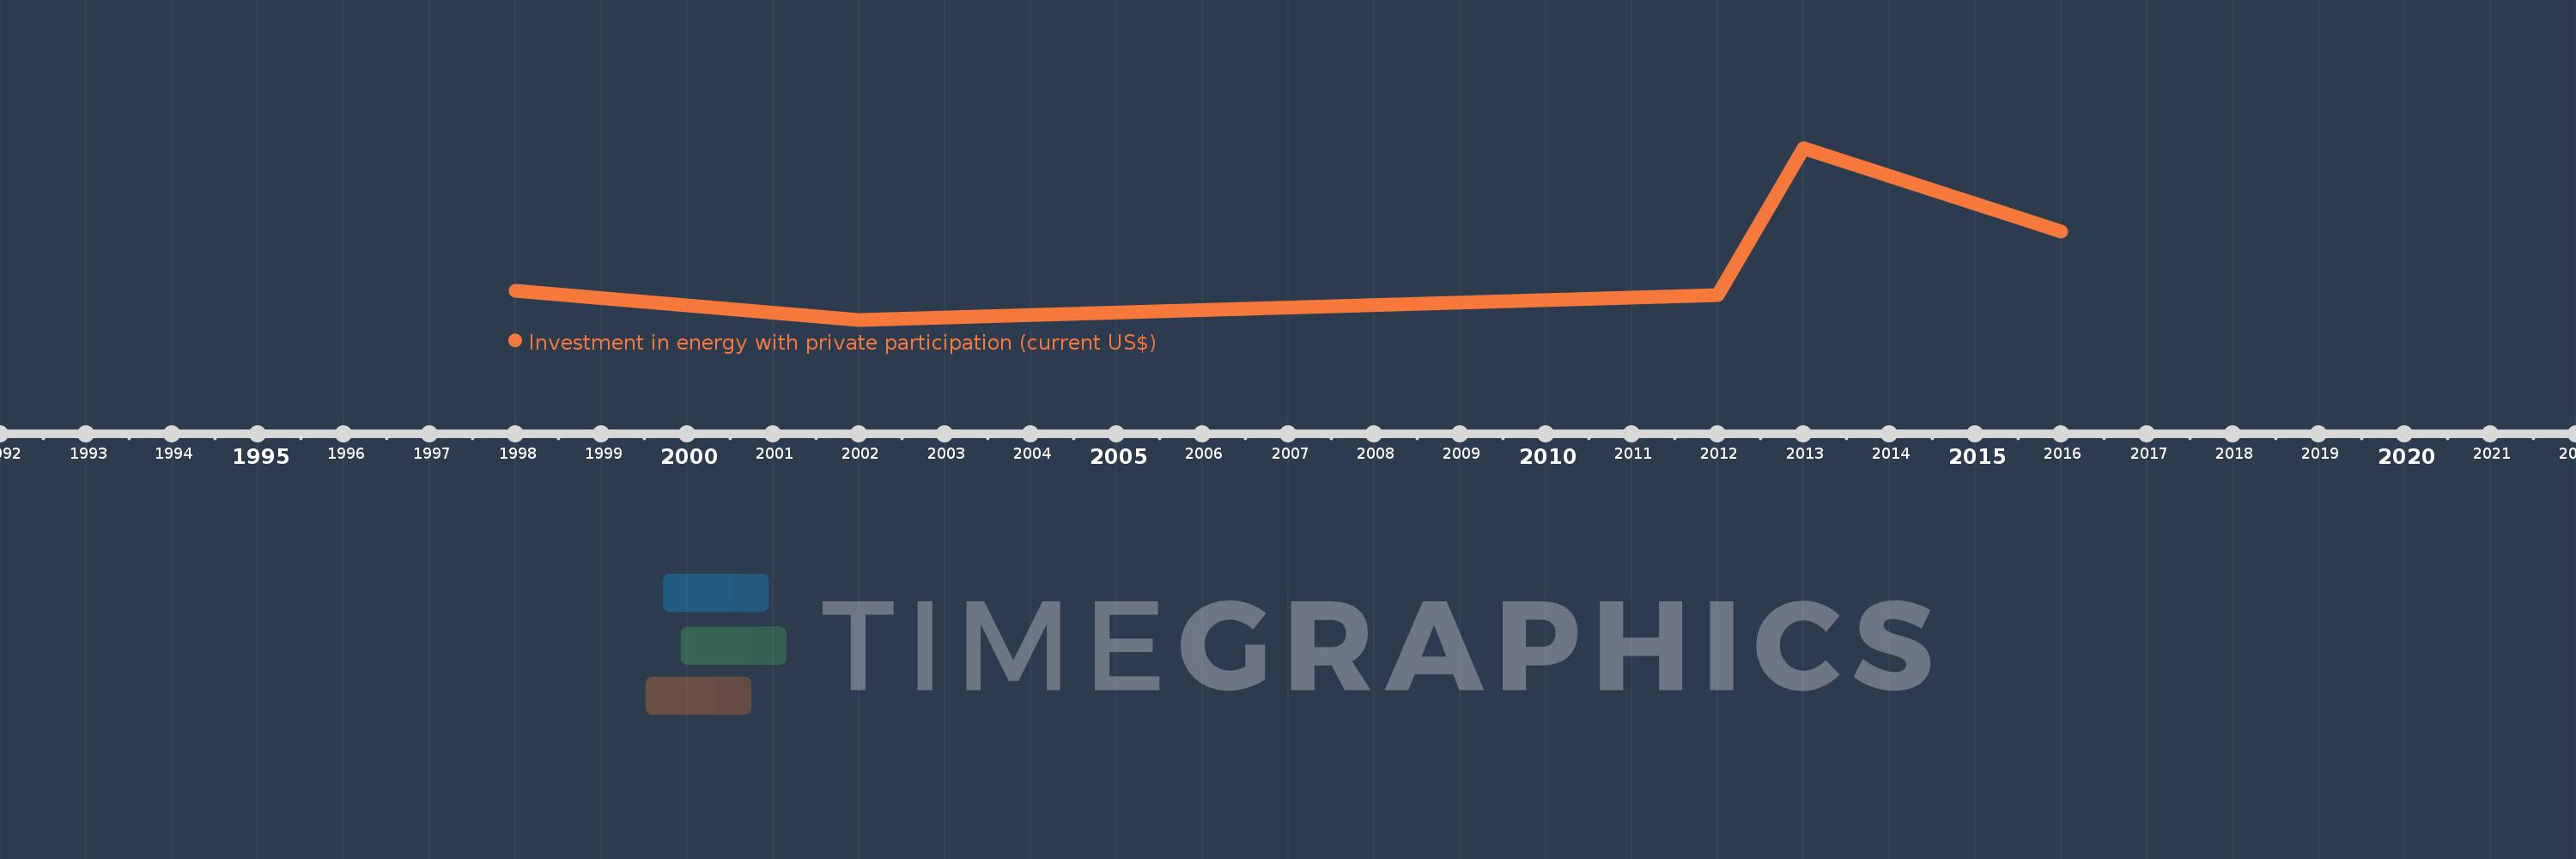
This timeline shows a graph from 1998 to 2016 of Zambia. No data until 1997. Number of actual observations by date: 5.
Source name:
World Development Indicators
Source organization:
World Bank, Private Participation in Infrastructure Project Database (http://ppi.worldbank.org).
Categories, topics:
Energy & Mining, Infrastructure, Private Sector
Last updated:
apr 23, 2017
Indicators value changes by year
Minimum:
3.0 mln
jan 1, 2002
Maximum:
1.61 bln
jan 1, 2013
At the date of observation
Value
Absolute change
Change from the previous value
jan 1, 1998
274.0 mln
+274.0 mln
0.0%
jan 1, 2002
3.0 mln
-271.0 mln
-98.91%
jan 1, 2012
230.0 mln
+227.0 mln
7.57K%
jan 1, 2013
1.61 bln
+1.38 bln
600.0%
jan 1, 2016
830.0 mln
-780.0 mln
-48.45%
Ranking of countries by current statistics by years