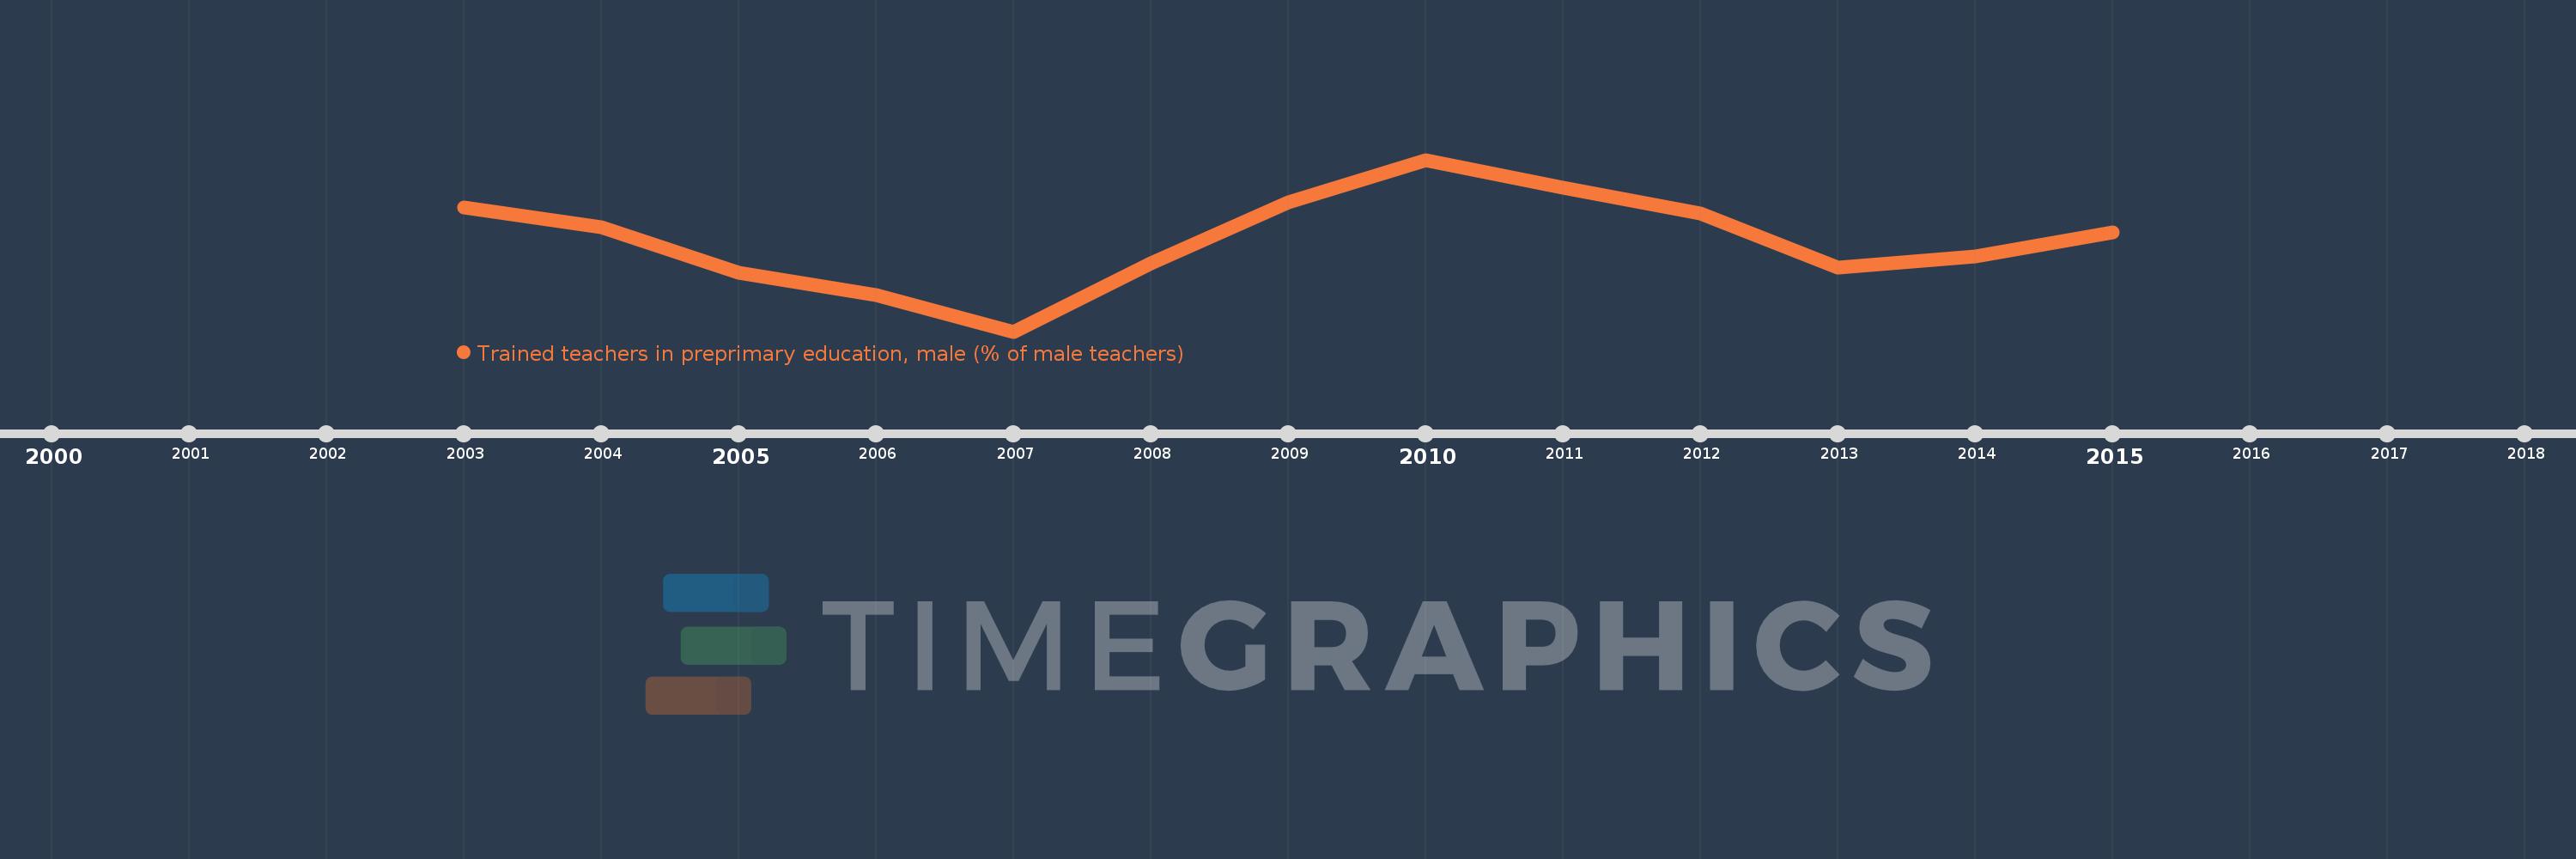
This timeline shows a graph from 2003 to 2015 of Sub-Saharan Africa (IDA & IBRD countries). No data until 2002. Number of actual observations by date: 13.
Source name:
World Development Indicators
Source organization:
United Nations Educational, Scientific, and Cultural Organization (UNESCO) Institute for Statistics.
Categories, topics:
Education
Last updated:
apr 23, 2017
Indicators value changes by year
Meaning:
41.29
Minimum:
31.476
jan 1, 2007
Maximum:
49.827
jan 1, 2010
At the date of observation
Value
Absolute change
Change from the previous value
jan 1, 2003
44.758
+44.758
0.0%
jan 1, 2004
42.657
-2.101
-4.69%
jan 1, 2005
37.772
-4.884
-11.45%
jan 1, 2006
35.416
-2.356
-6.24%
jan 1, 2007
31.476
-3.94
-11.12%
jan 1, 2008
38.813
+7.336
23.31%
jan 1, 2009
45.297
+6.484
16.71%
jan 1, 2010
49.827
+4.53
10.0%
jan 1, 2011
46.814
-3.013
-6.05%
jan 1, 2012
44.081
-2.733
-5.84%
jan 1, 2013
38.284
-5.797
-13.15%
jan 1, 2014
39.513
+1.229
3.21%
jan 1, 2015
42.062
+2.549
6.45%
Ranking of countries by current statistics by years