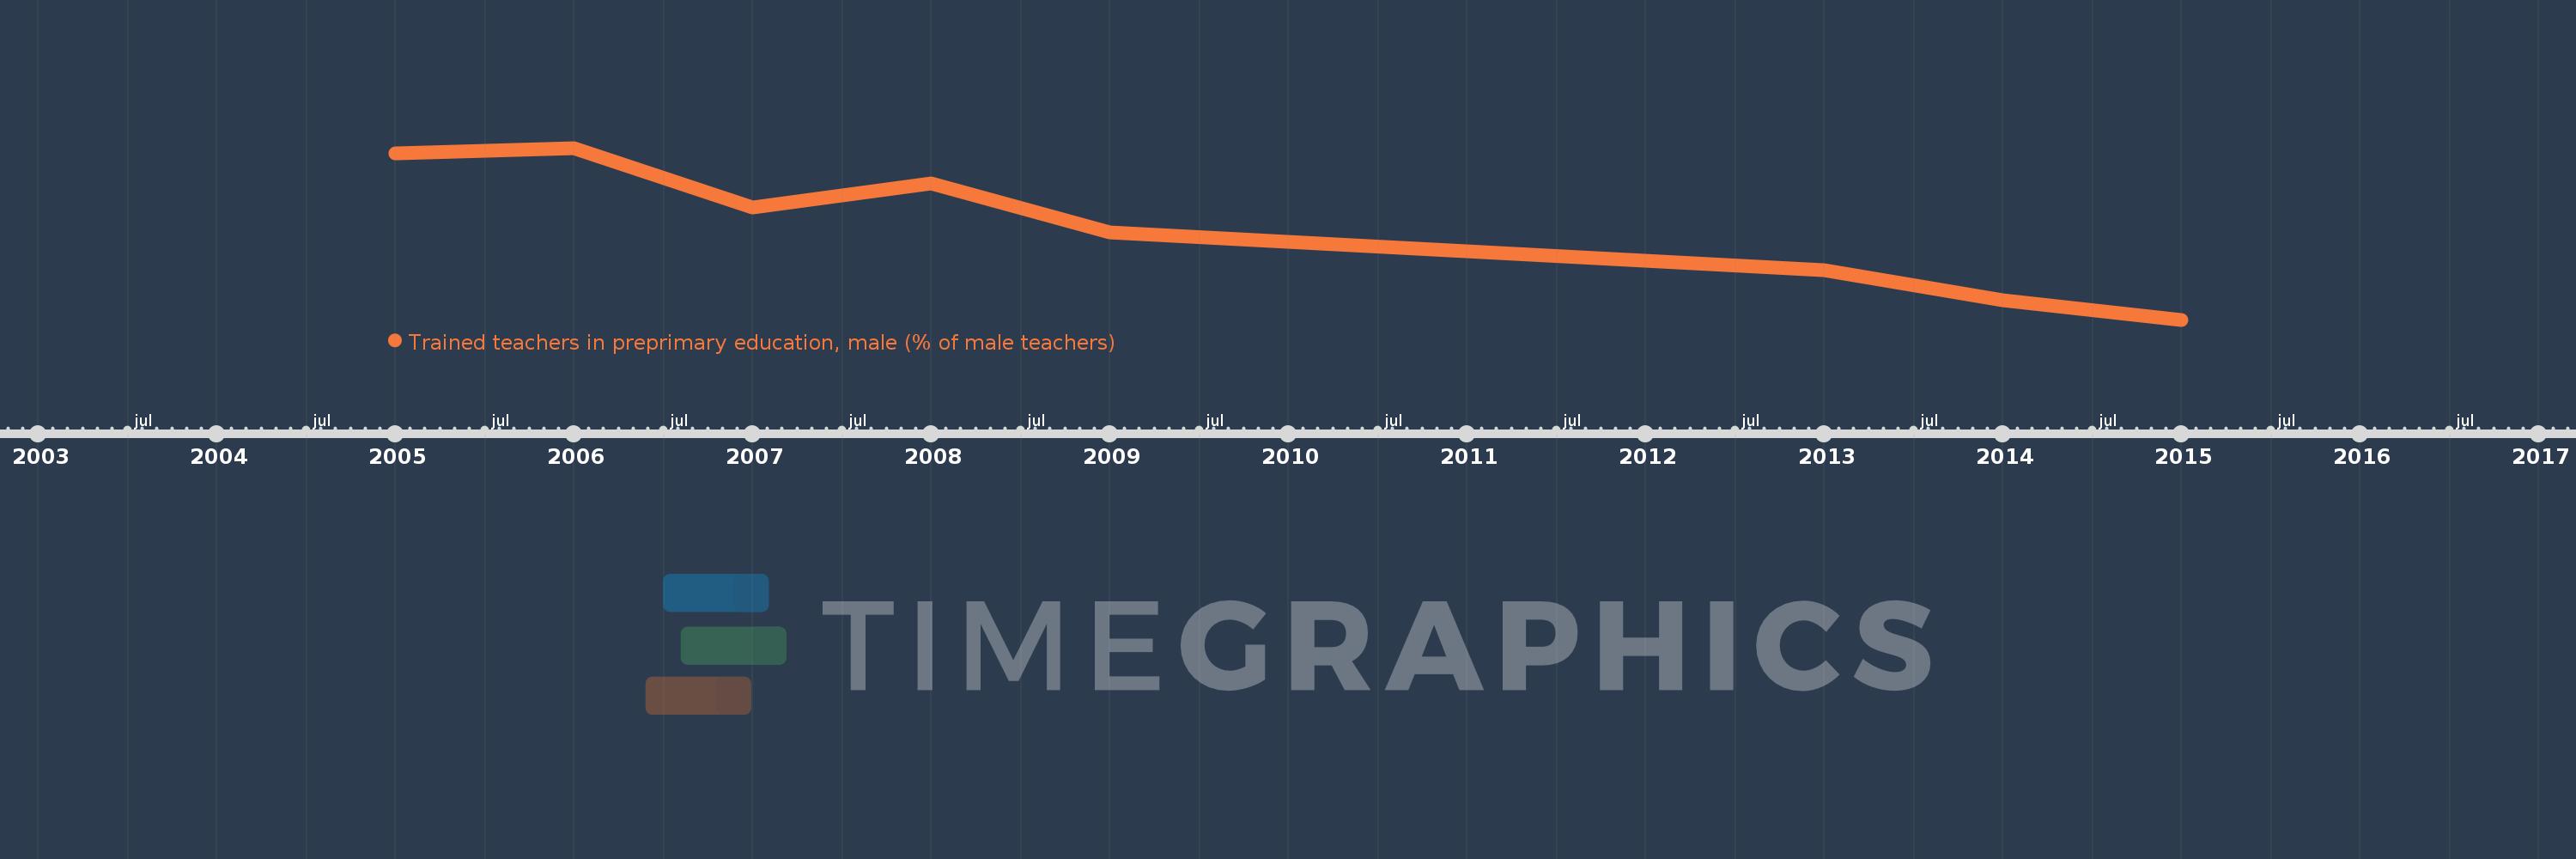
This timeline shows a graph from 2005 to 2015 of Middle East & North Africa (excluding high income). No data until 2004. Number of actual observations by date: 8.
Source name:
World Development Indicators
Source organization:
United Nations Educational, Scientific, and Cultural Organization (UNESCO) Institute for Statistics.
Categories, topics:
Education
Last updated:
apr 23, 2017
Indicators value changes by year
Meaning:
90.821
Minimum:
83.974
jan 1, 2015
Maximum:
96.626
jan 1, 2006
At the date of observation
Value
Absolute change
Change from the previous value
jan 1, 2005
96.221
+96.221
0.0%
jan 1, 2006
96.626
+0.406
0.42%
jan 1, 2007
92.235
-4.391
-4.54%
jan 1, 2008
93.986
+1.75
1.9%
jan 1, 2009
90.428
-3.557
-3.79%
jan 1, 2013
87.654
-2.774
-3.07%
jan 1, 2014
85.441
-2.213
-2.53%
jan 1, 2015
83.974
-1.467
-1.72%
Ranking of countries by current statistics by years