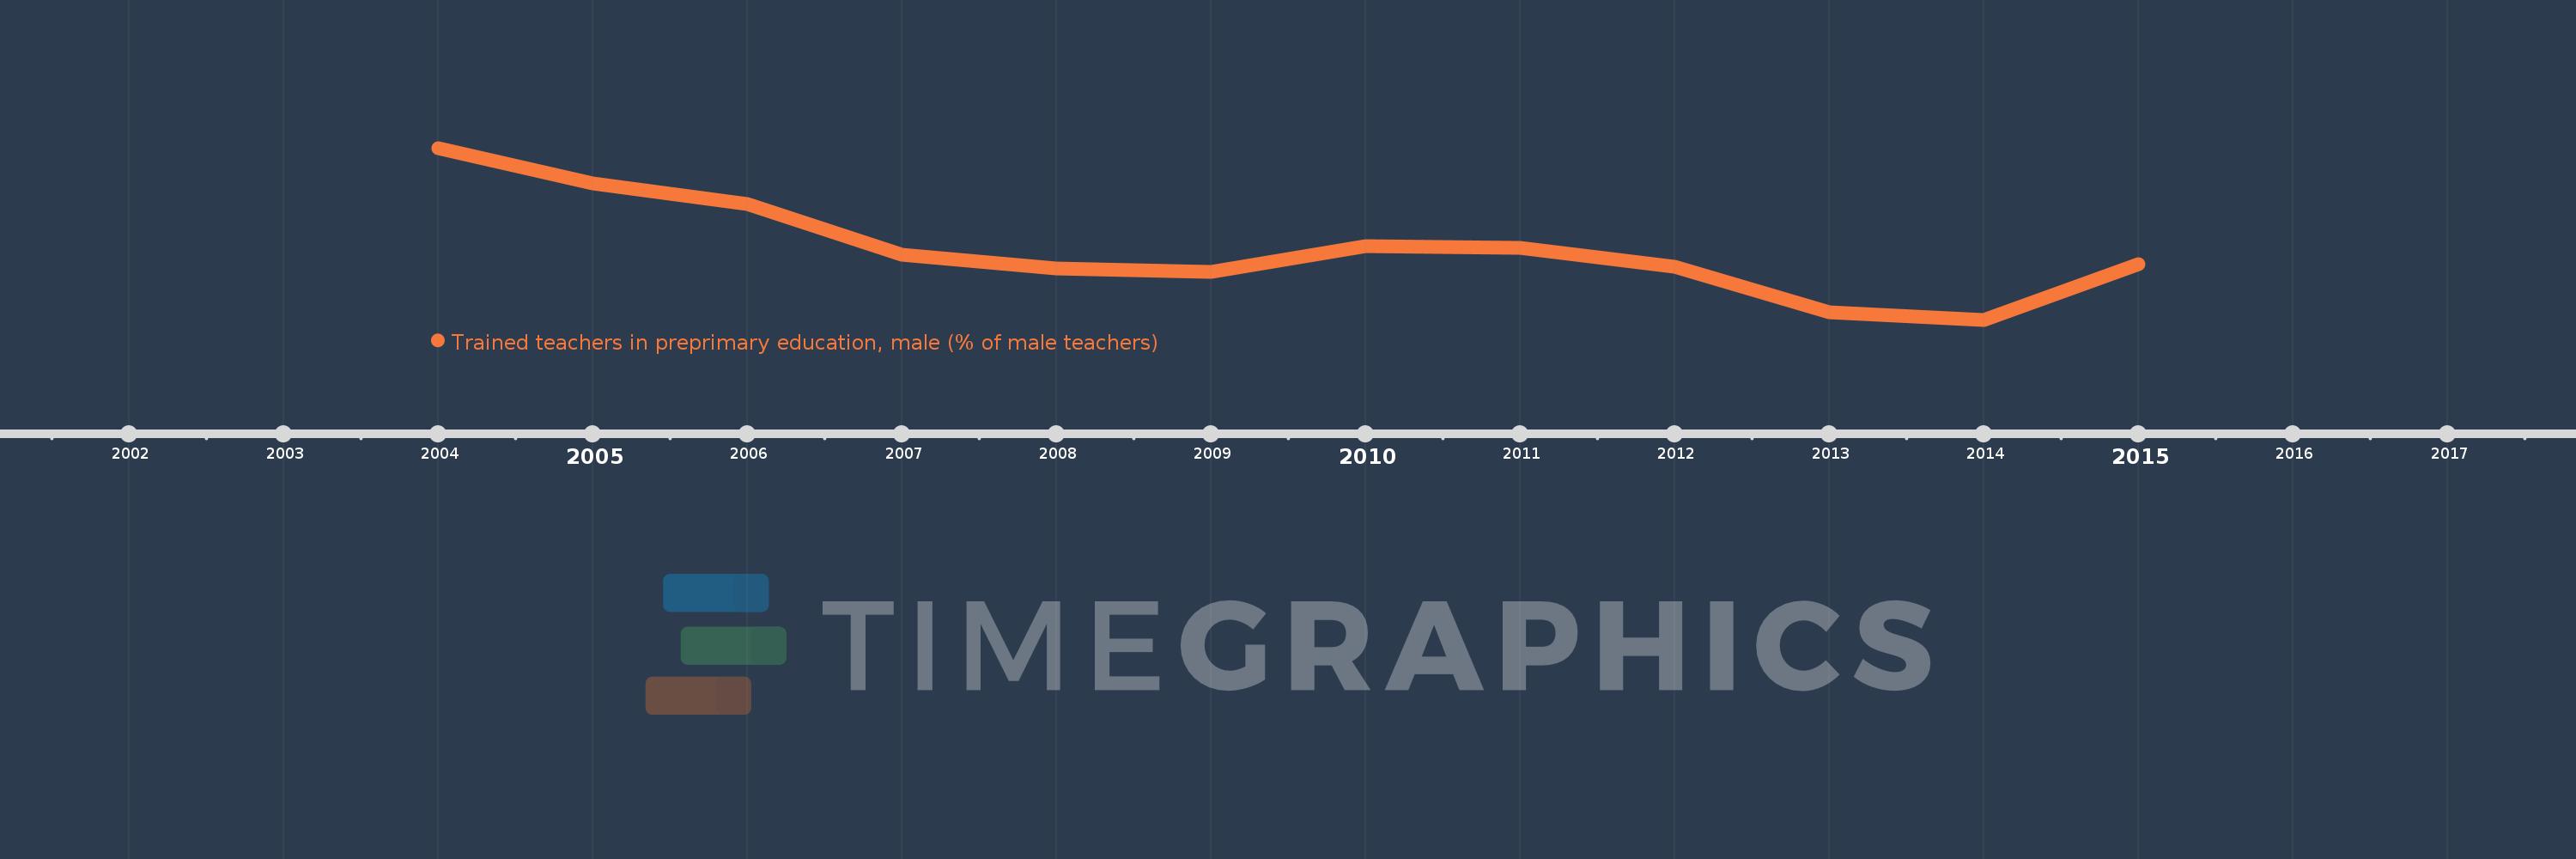
This timeline shows a graph from 2004 to 2015 of Heavily indebted poor countries (HIPC). No data until 2003. Number of actual observations by date: 12.
Source name:
World Development Indicators
Source organization:
United Nations Educational, Scientific, and Cultural Organization (UNESCO) Institute for Statistics.
Categories, topics:
Education
Last updated:
apr 23, 2017
Indicators value changes by year
Meaning:
36.995
Minimum:
25.287
jan 1, 2014
Maximum:
53.675
jan 1, 2004
At the date of observation
Value
Absolute change
Change from the previous value
jan 1, 2004
53.675
+53.675
0.0%
jan 1, 2005
47.759
-5.916
-11.02%
jan 1, 2006
44.466
-3.293
-6.9%
jan 1, 2007
36.034
-8.432
-18.96%
jan 1, 2008
33.743
-2.291
-6.36%
jan 1, 2009
33.253
-0.49
-1.45%
jan 1, 2010
37.476
+4.223
12.7%
jan 1, 2011
37.156
-0.32
-0.85%
jan 1, 2012
34.092
-3.064
-8.25%
jan 1, 2013
26.527
-7.565
-22.19%
jan 1, 2014
25.287
-1.24
-4.68%
jan 1, 2015
34.474
+9.187
36.33%
Ranking of countries by current statistics by years