Download This statistics in other country:
Timeline:
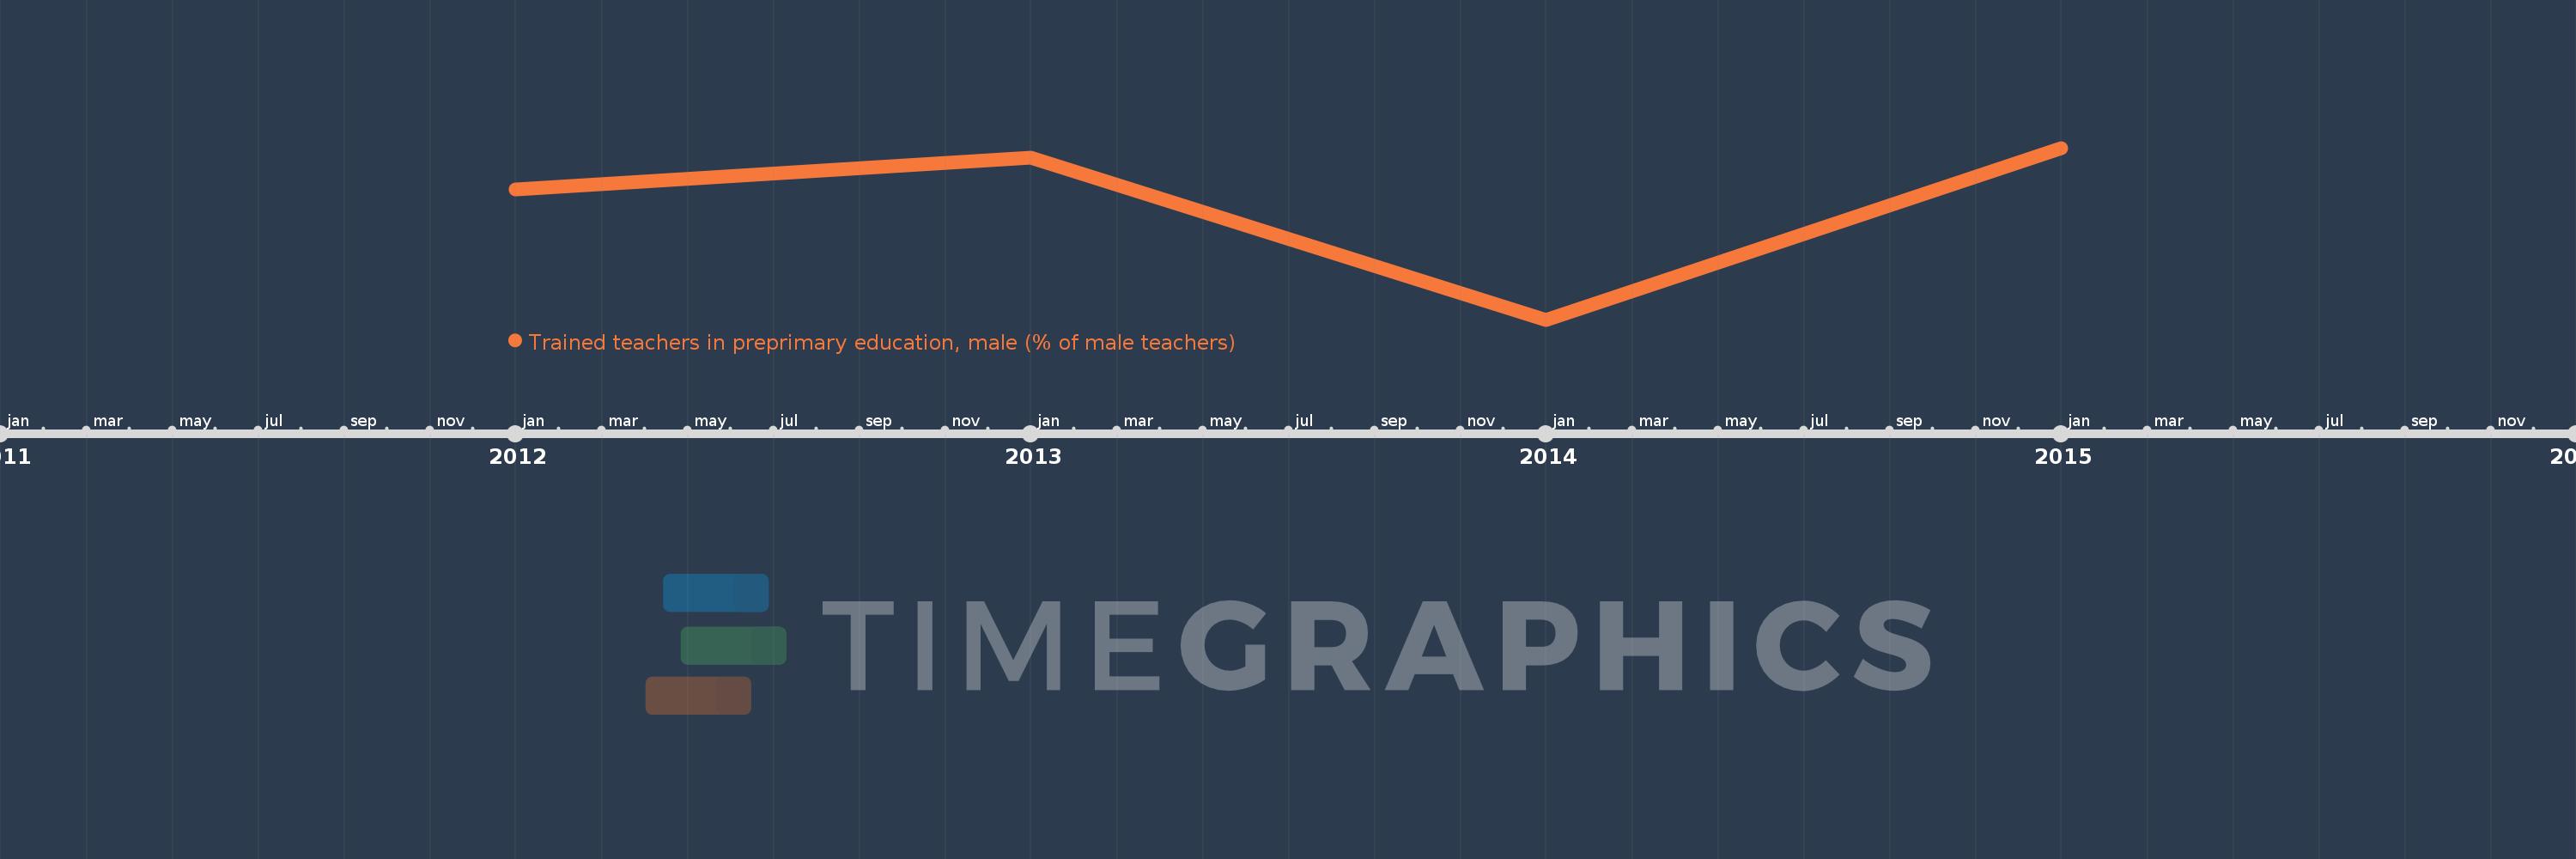
This timeline shows a graph from 2012 to 2015 of Malaysia. No data until 2011. Number of actual observations by date: 4.
Source name:
World Development Indicators
Source organization:
United Nations Educational, Scientific, and Cultural Organization (UNESCO) Institute for Statistics.
Categories, topics:
Education
Last updated:
apr 23, 2017
Indicators value changes by year
Minimum:
98.903
jan 1, 2014
Maximum:
99.891
jan 1, 2015
At the date of observation
Value
Absolute change
Change from the previous value
jan 1, 2012
99.65
+99.65
0.0%
jan 1, 2013
99.835
+0.185
0.19%
jan 1, 2014
98.903
-0.932
-0.93%
jan 1, 2015
99.891
+0.988
1.0%
Ranking of countries by current statistics by years