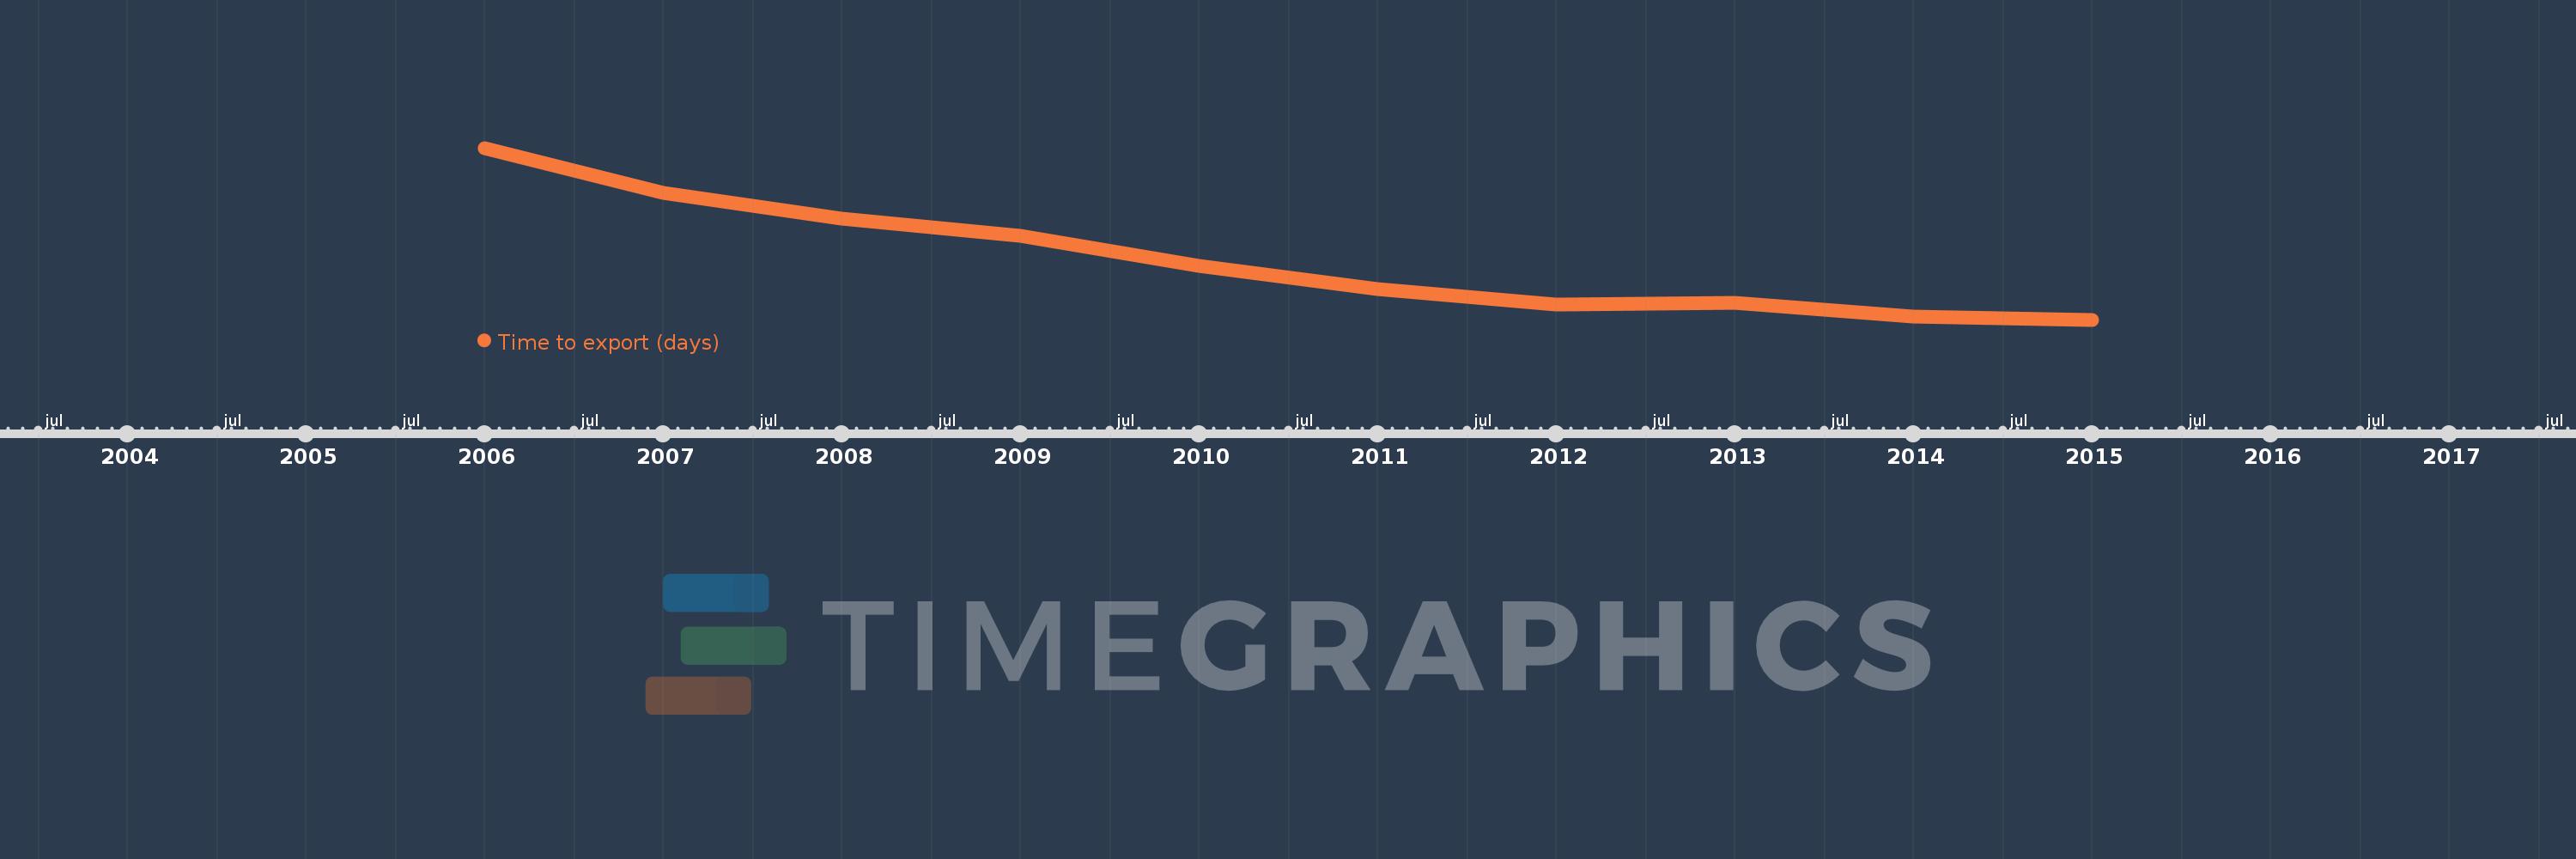
This timeline shows a graph from 2006 to 2015 of Sub-Saharan Africa (IDA & IBRD countries). No data until 2005. Number of actual observations by date: 10.
Source name:
World Development Indicators
Source organization:
World Bank, Doing Business project (http://www.doingbusiness.org/).
Categories, topics:
Private Sector, Trade
Last updated:
apr 23, 2017
Indicators value changes by year
Meaning:
33.295
Minimum:
30.509
jan 1, 2015
Maximum:
38.436
jan 1, 2006
At the date of observation
Value
Absolute change
Change from the previous value
jan 1, 2006
38.436
+38.436
0.0%
jan 1, 2007
36.37
-2.066
-5.38%
jan 1, 2008
35.174
-1.196
-3.29%
jan 1, 2009
34.376
-0.798
-2.27%
jan 1, 2010
33.007
-1.37
-3.98%
jan 1, 2011
31.924
-1.083
-3.28%
jan 1, 2012
31.228
-0.696
-2.18%
jan 1, 2013
31.287
+0.059
0.19%
jan 1, 2014
30.636
-0.651
-2.08%
jan 1, 2015
30.509
-0.128
-0.42%
Ranking of countries by current statistics by years