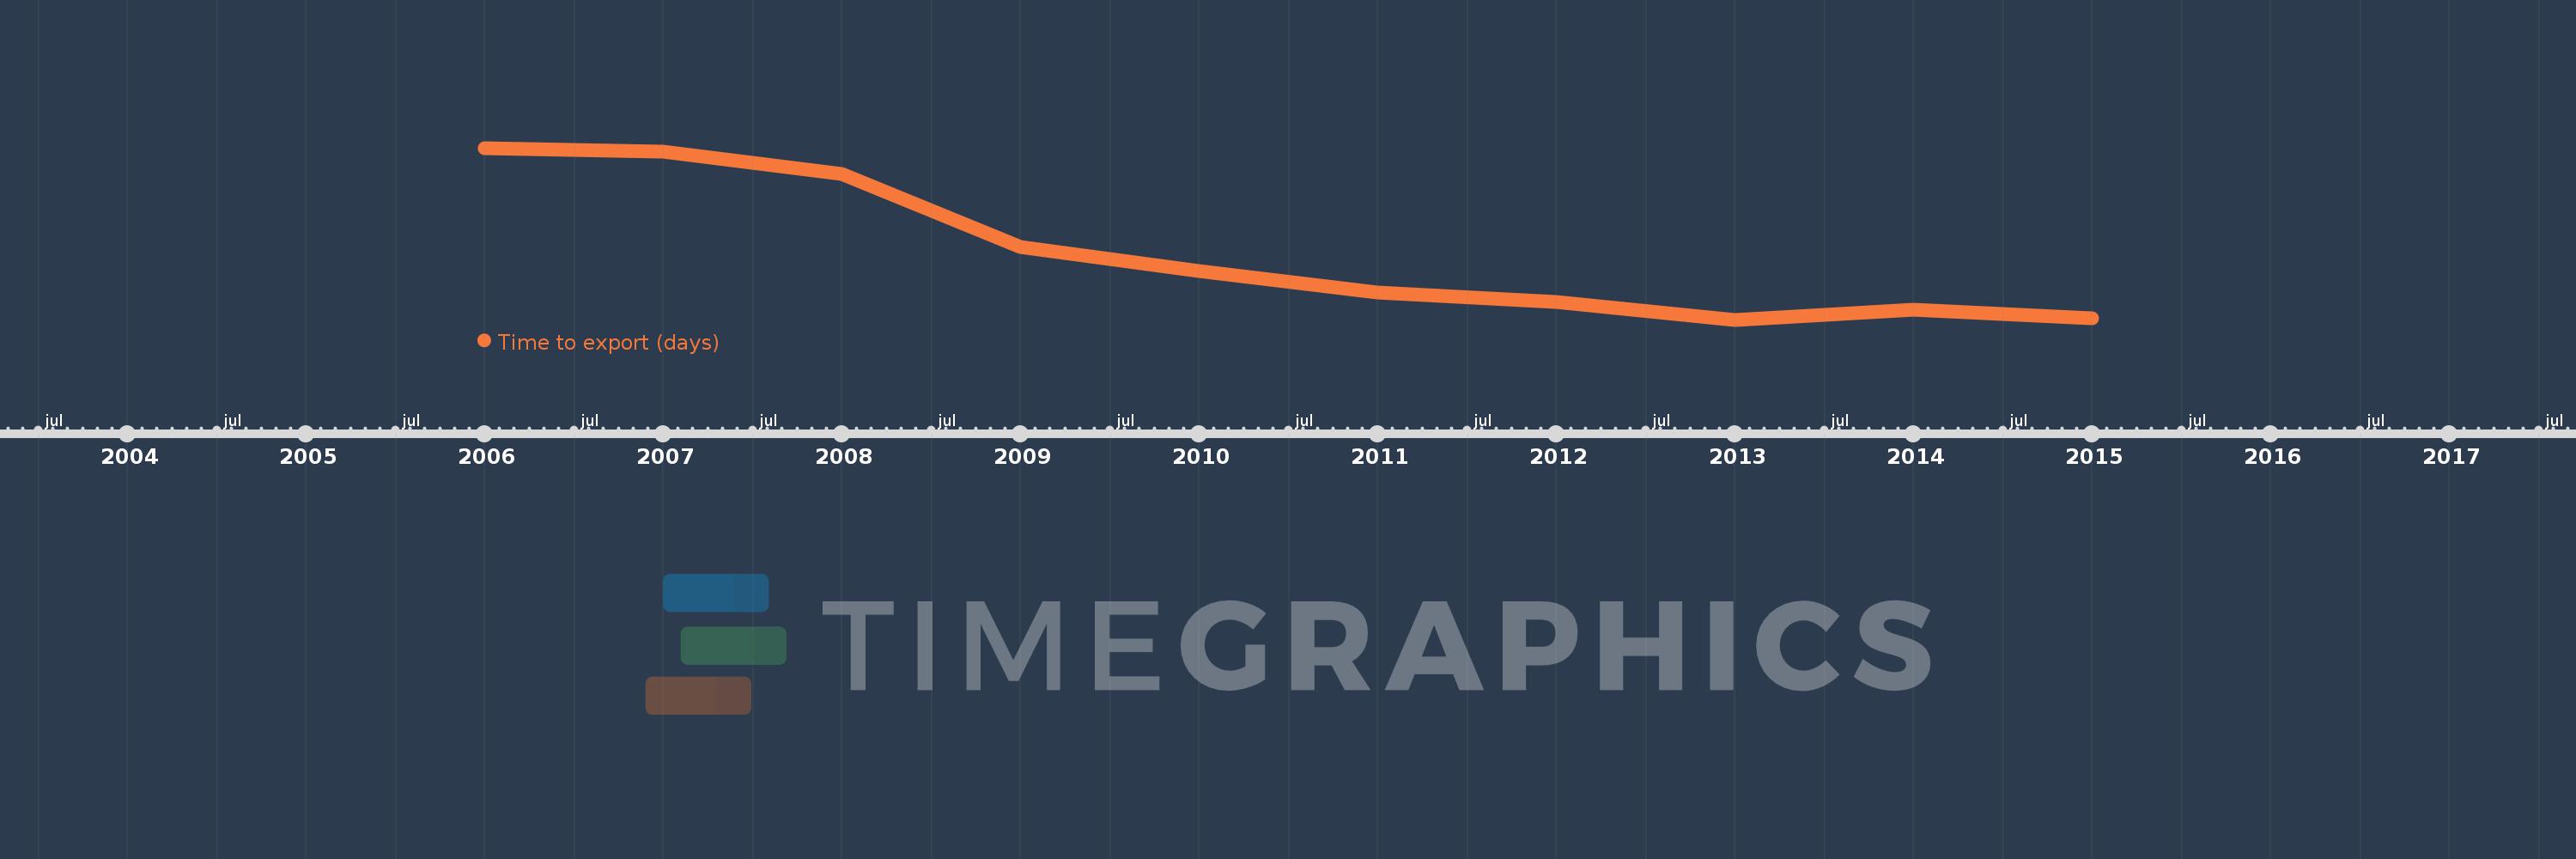
This timeline shows a graph from 2006 to 2015 of Latin America & the Caribbean (IDA & IBRD countries). No data until 2005. Number of actual observations by date: 10.
Source name:
World Development Indicators
Source organization:
World Bank, Doing Business project (http://www.doingbusiness.org/).
Categories, topics:
Private Sector, Trade
Last updated:
apr 23, 2017
Indicators value changes by year
Meaning:
18.738
Minimum:
16.897
jan 1, 2013
Maximum:
21.66
jan 1, 2006
At the date of observation
Value
Absolute change
Change from the previous value
jan 1, 2006
21.66
+21.66
0.0%
jan 1, 2007
21.56
-0.1
-0.46%
jan 1, 2008
20.927
-0.633
-2.94%
jan 1, 2009
18.91
-2.017
-9.64%
jan 1, 2010
18.237
-0.673
-3.56%
jan 1, 2011
17.663
-0.573
-3.14%
jan 1, 2012
17.397
-0.267
-1.51%
jan 1, 2013
16.897
-0.5
-2.87%
jan 1, 2014
17.18
+0.283
1.68%
jan 1, 2015
16.947
-0.233
-1.36%
Ranking of countries by current statistics by years