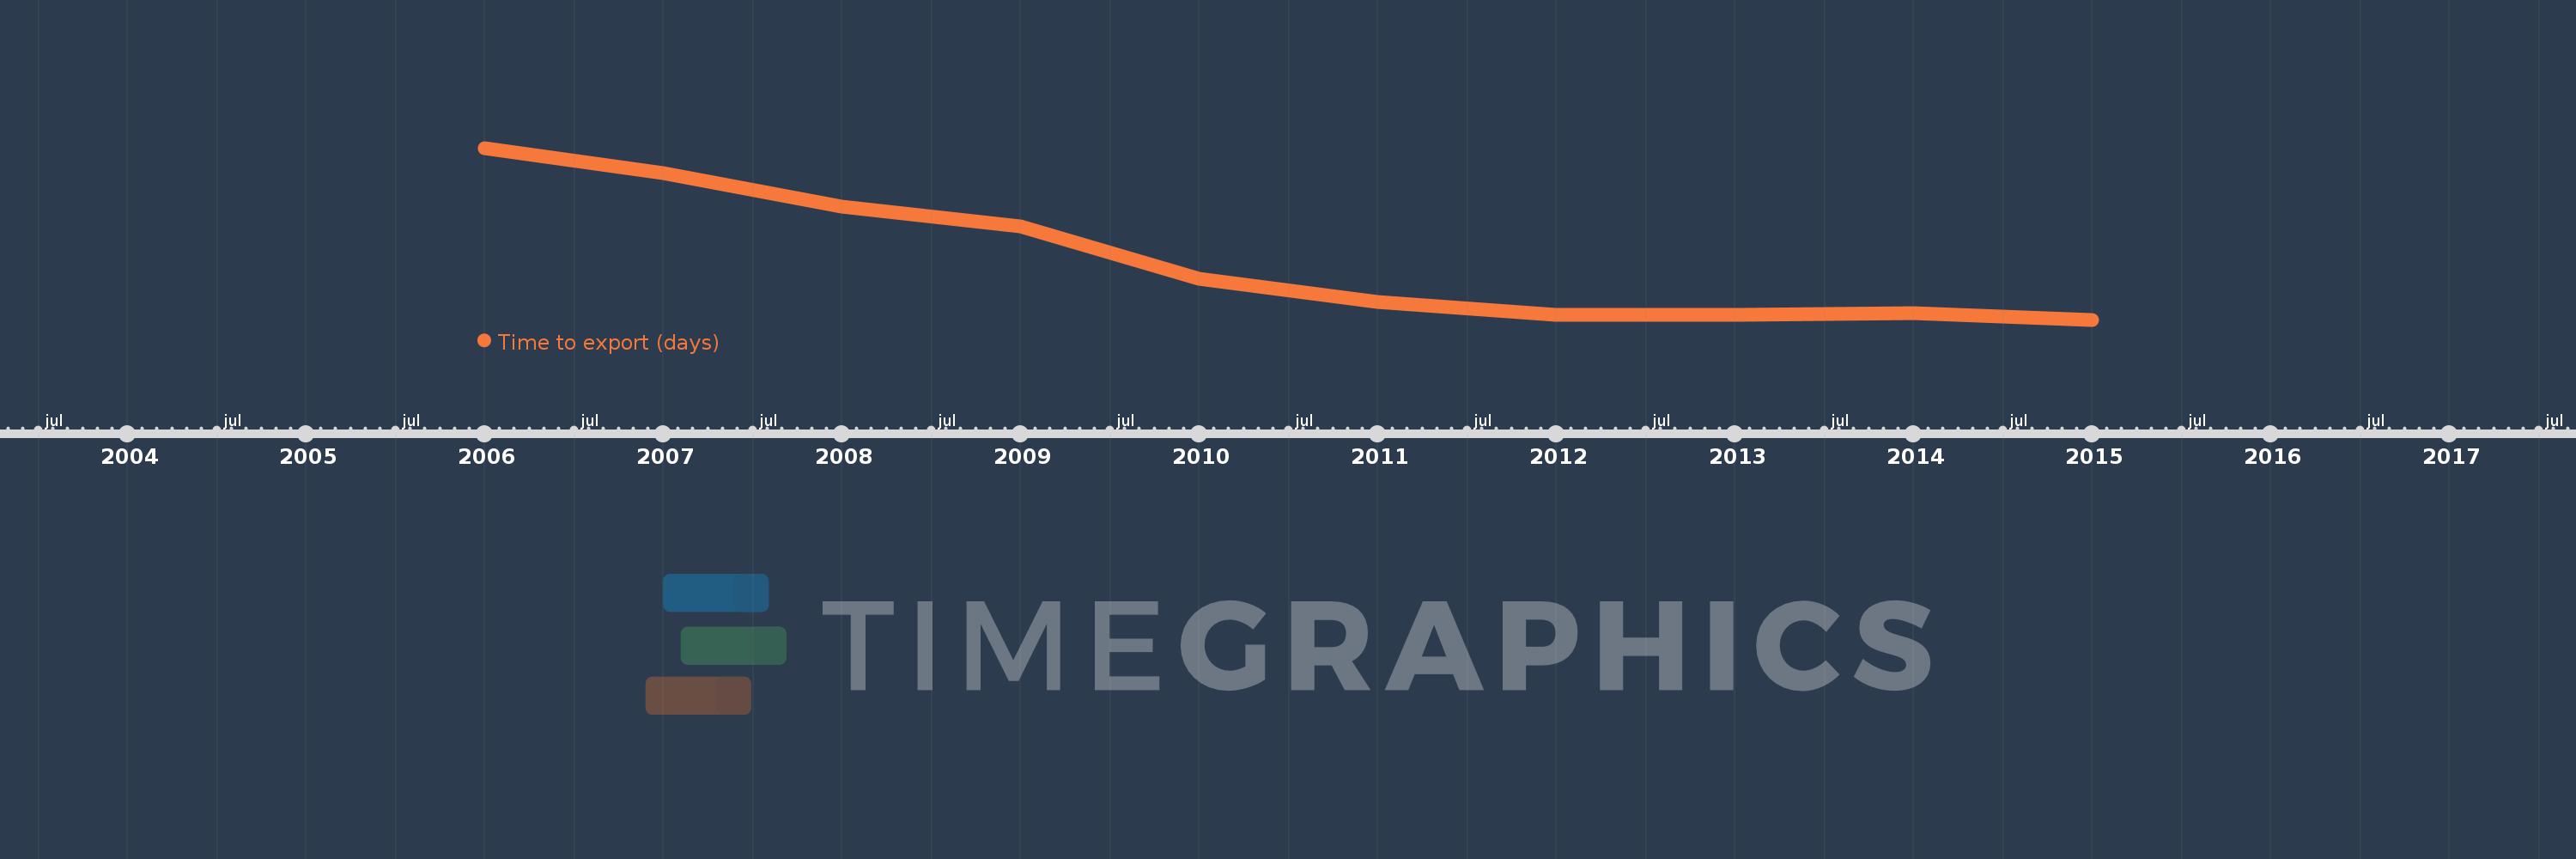
This timeline shows a graph from 2006 to 2015 of Fragile and conflict affected situations. No data until 2005. Number of actual observations by date: 10.
Source name:
World Development Indicators
Source organization:
World Bank, Doing Business project (http://www.doingbusiness.org/).
Categories, topics:
Private Sector, Trade
Last updated:
apr 23, 2017
Indicators value changes by year
Meaning:
35.214
Minimum:
32.606
jan 1, 2015
Maximum:
40.071
jan 1, 2006
At the date of observation
Value
Absolute change
Change from the previous value
jan 1, 2006
40.071
+40.071
0.0%
jan 1, 2007
38.966
-1.106
-2.76%
jan 1, 2008
37.517
-1.448
-3.72%
jan 1, 2009
36.655
-0.862
-2.3%
jan 1, 2010
34.4
-2.255
-6.15%
jan 1, 2011
33.367
-1.033
-3.0%
jan 1, 2012
32.833
-0.533
-1.6%
jan 1, 2013
32.818
-0.015
-0.05%
jan 1, 2014
32.909
+0.091
0.28%
jan 1, 2015
32.606
-0.303
-0.92%
Ranking of countries by current statistics by years