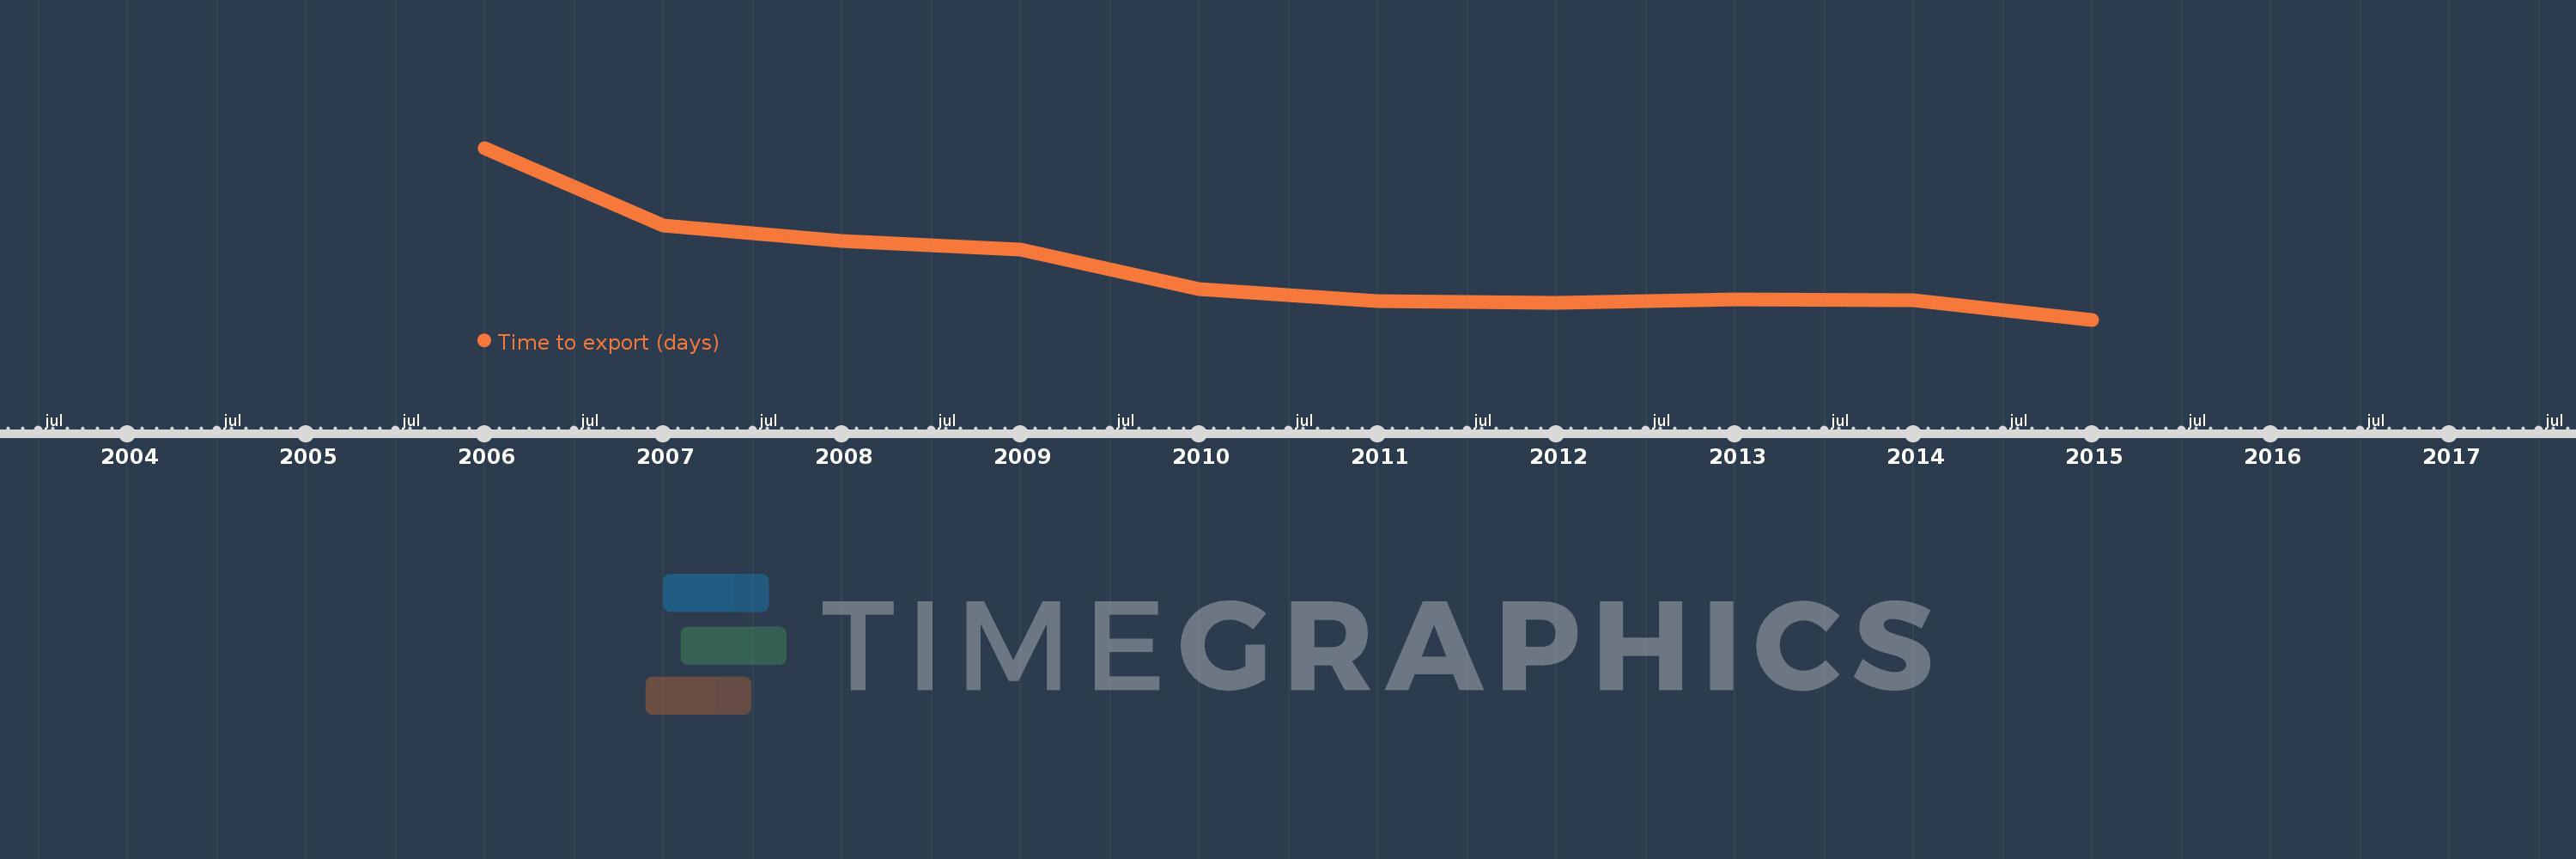
This timeline shows a graph from 2006 to 2015 of Europe & Central Asia (IDA & IBRD countries). No data until 2005. Number of actual observations by date: 10.
Source name:
World Development Indicators
Source organization:
World Bank, Doing Business project (http://www.doingbusiness.org/).
Categories, topics:
Private Sector, Trade
Last updated:
apr 23, 2017
Indicators value changes by year
Meaning:
29.114
Minimum:
25.914
jan 1, 2015
Maximum:
36.44
jan 1, 2006
At the date of observation
Value
Absolute change
Change from the previous value
jan 1, 2006
36.44
+36.44
0.0%
jan 1, 2007
31.705
-4.735
-12.99%
jan 1, 2008
30.752
-0.952
-3.0%
jan 1, 2009
30.229
-0.524
-1.7%
jan 1, 2010
27.809
-2.419
-8.0%
jan 1, 2011
27.082
-0.727
-2.62%
jan 1, 2012
26.945
-0.136
-0.5%
jan 1, 2013
27.173
+0.227
0.84%
jan 1, 2014
27.095
-0.077
-0.28%
jan 1, 2015
25.914
-1.182
-4.36%
Ranking of countries by current statistics by years