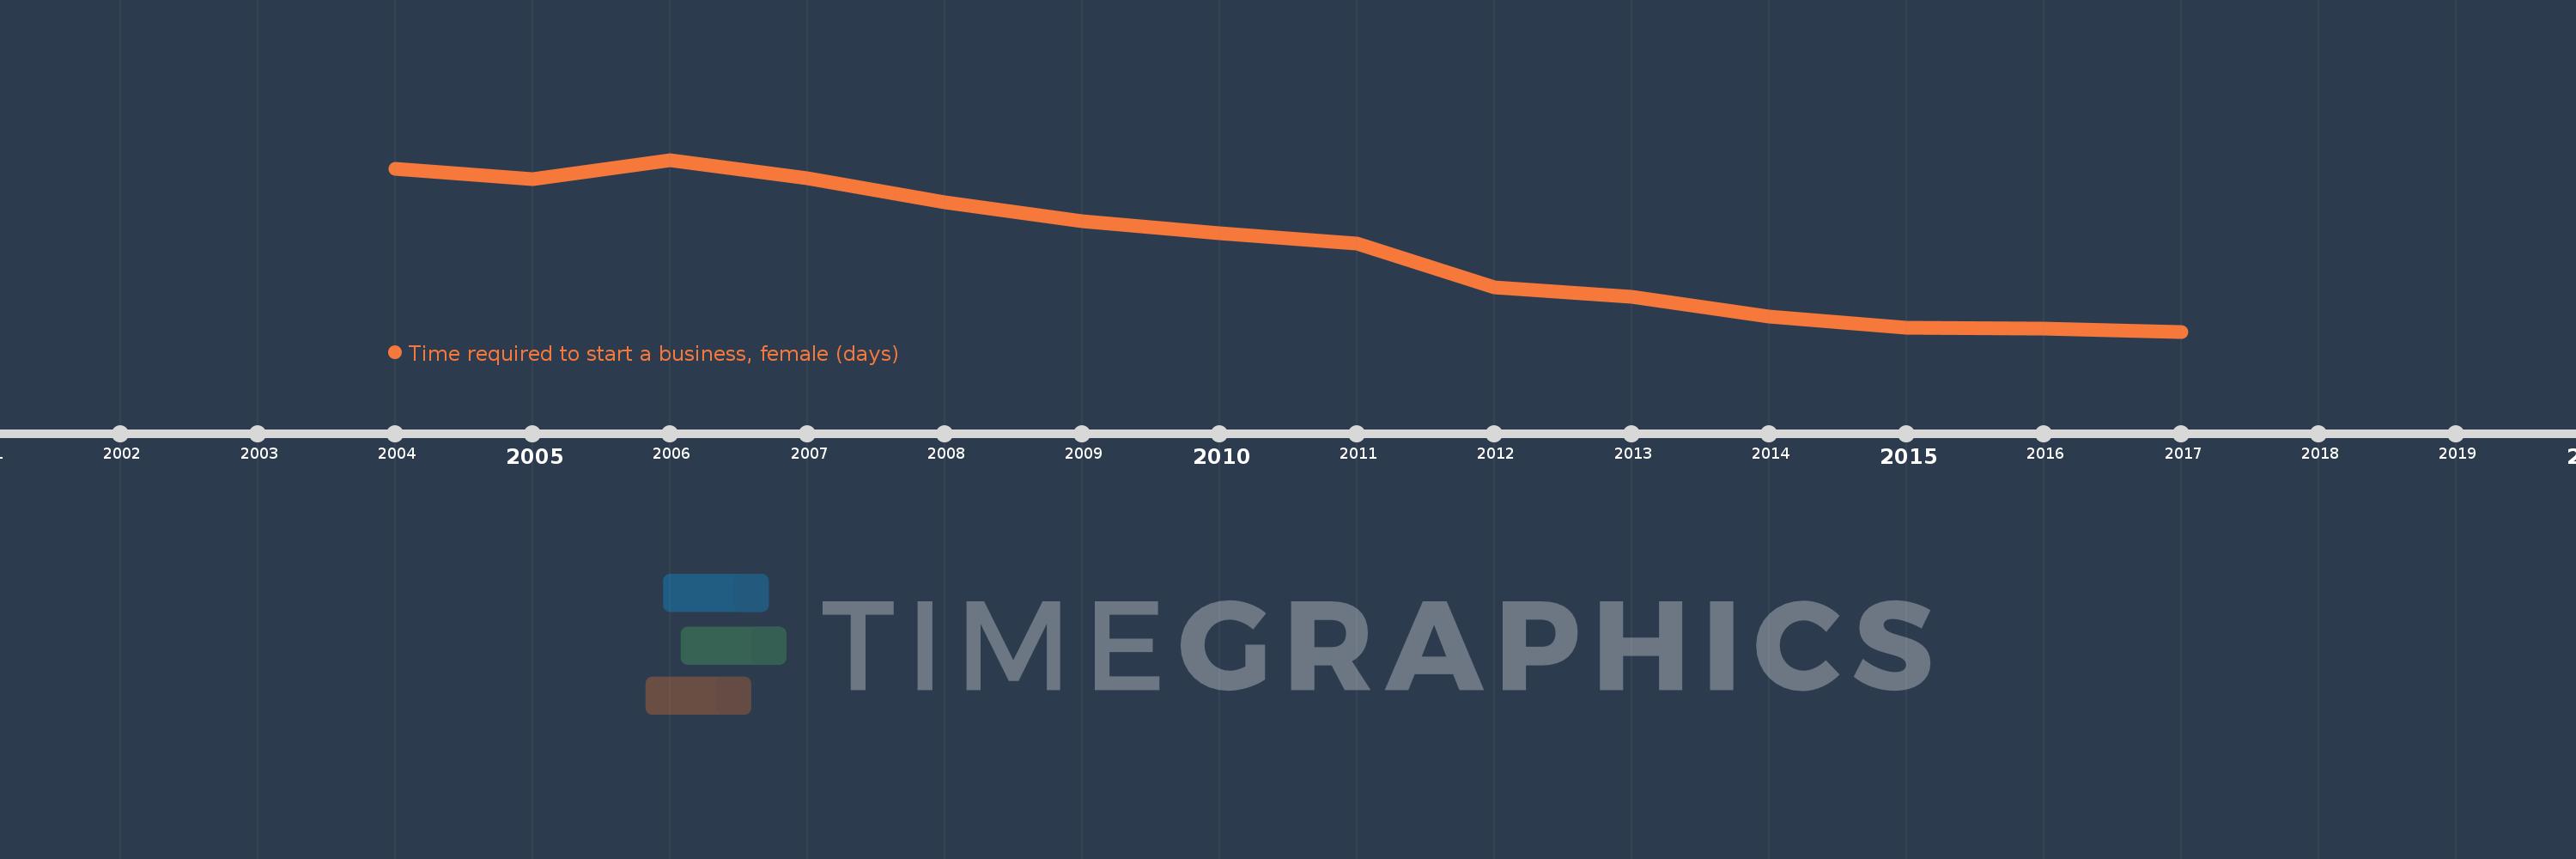
This timeline shows a graph from 2004 to 2017 of Sub-Saharan Africa (IDA & IBRD countries). No data until 2003. Number of actual observations by date: 14.
Source name:
World Development Indicators
Source organization:
World Bank, Doing Business project (http://www.doingbusiness.org/).
Categories, topics:
Private Sector
Last updated:
apr 23, 2017
Indicators value changes by year
Meaning:
44.84
Minimum:
27.452
jan 1, 2017
Maximum:
63.244
jan 1, 2006
At the date of observation
Value
Absolute change
Change from the previous value
jan 1, 2004
61.394
+61.394
0.0%
jan 1, 2005
59.216
-2.178
-3.55%
jan 1, 2006
63.244
+4.028
6.8%
jan 1, 2007
59.391
-3.853
-6.09%
jan 1, 2008
54.457
-4.935
-8.31%
jan 1, 2009
50.5
-3.957
-7.27%
jan 1, 2010
47.957
-2.543
-5.04%
jan 1, 2011
45.804
-2.152
-4.49%
jan 1, 2012
36.707
-9.098
-19.86%
jan 1, 2013
34.638
-2.068
-5.63%
jan 1, 2014
30.564
-4.074
-11.76%
jan 1, 2015
28.309
-2.255
-7.38%
jan 1, 2016
28.125
-0.184
-0.65%
jan 1, 2017
27.452
-0.673
-2.39%
Ranking of countries by current statistics by years