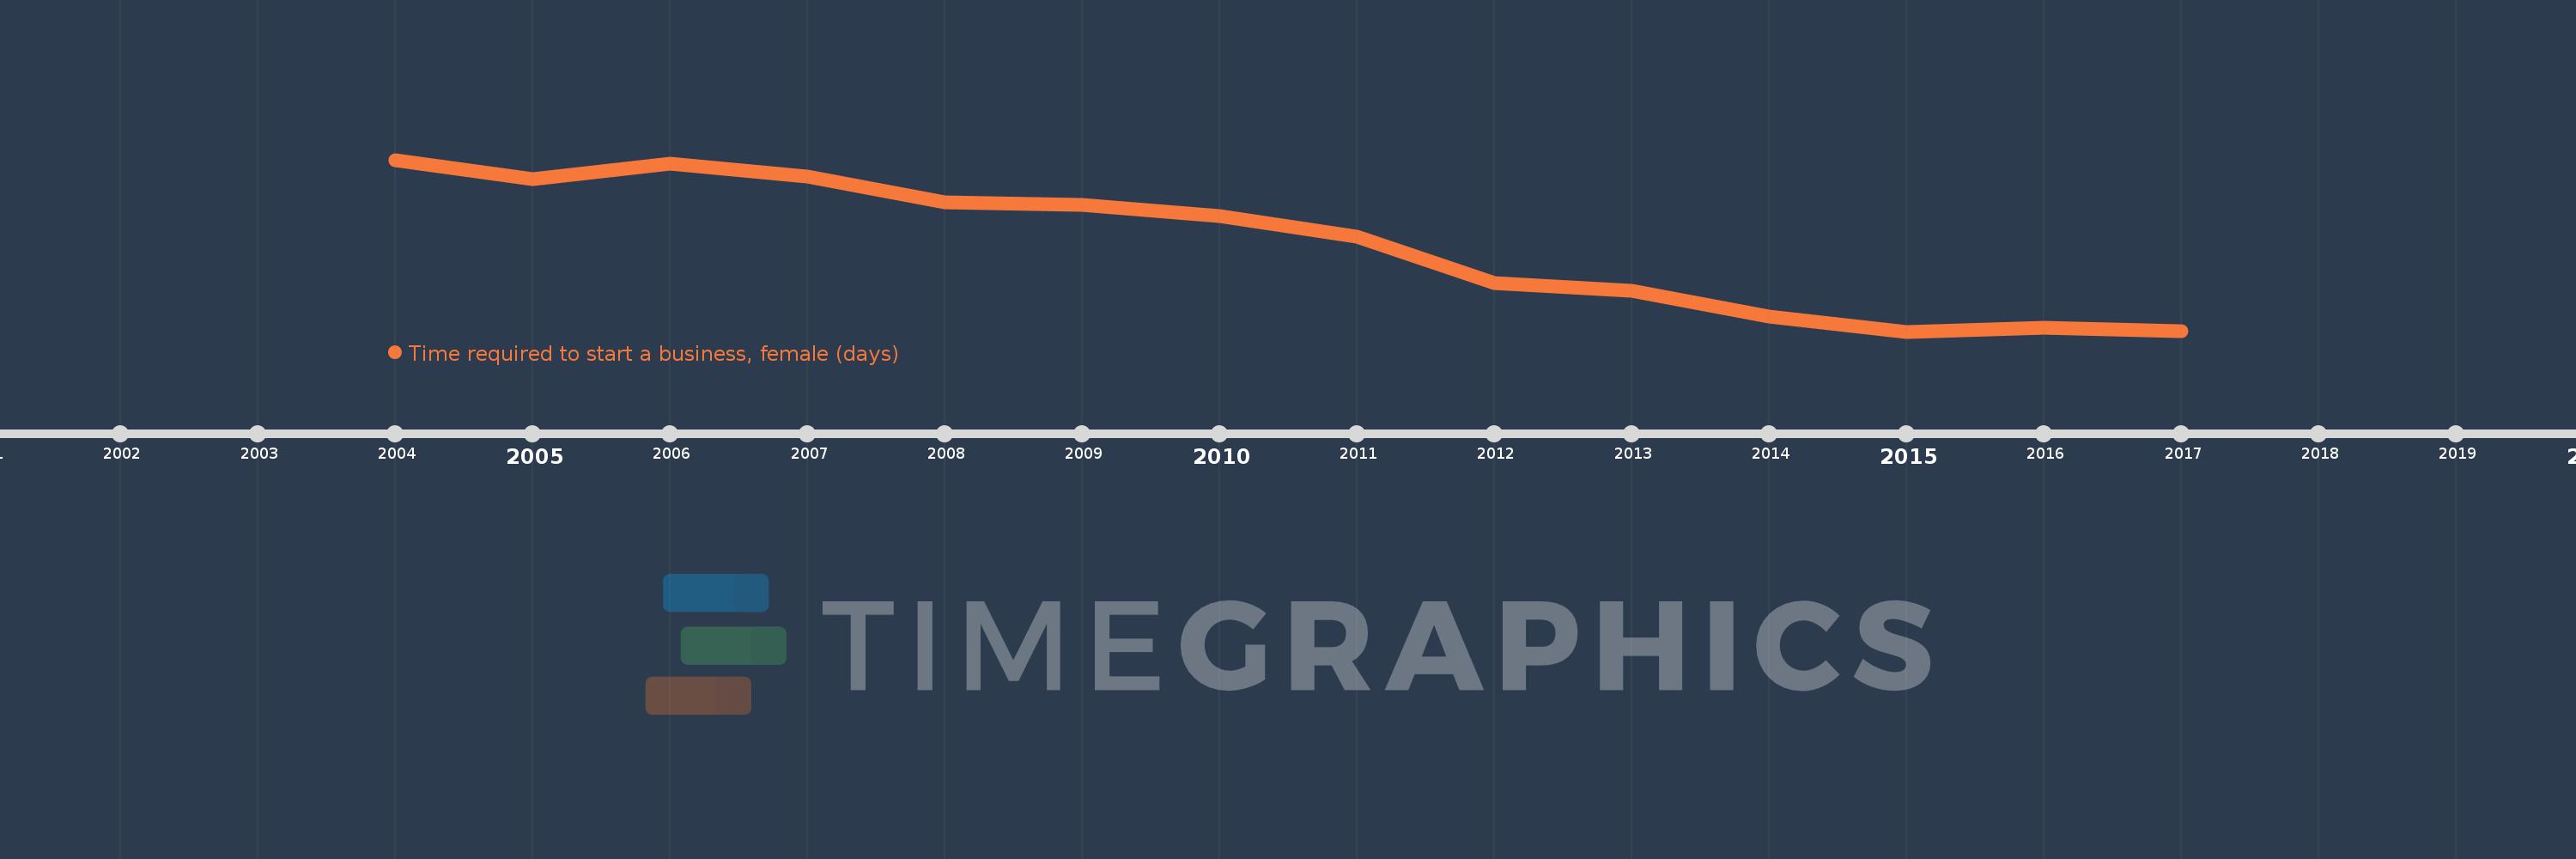
This timeline shows a graph from 2004 to 2017 of Heavily indebted poor countries (HIPC). No data until 2003. Number of actual observations by date: 14.
Source name:
World Development Indicators
Source organization:
World Bank, Doing Business project (http://www.doingbusiness.org/).
Categories, topics:
Private Sector
Last updated:
apr 23, 2017
Indicators value changes by year
Meaning:
41.337
Minimum:
22.211
jan 1, 2015
Maximum:
59.862
jan 1, 2004
At the date of observation
Value
Absolute change
Change from the previous value
jan 1, 2004
59.862
+59.862
0.0%
jan 1, 2005
55.676
-4.186
-6.99%
jan 1, 2006
58.946
+3.269
5.87%
jan 1, 2007
56.184
-2.762
-4.69%
jan 1, 2008
50.474
-5.711
-10.16%
jan 1, 2009
49.921
-0.553
-1.09%
jan 1, 2010
47.474
-2.447
-4.9%
jan 1, 2011
43.079
-4.395
-9.26%
jan 1, 2012
32.855
-10.224
-23.73%
jan 1, 2013
31.158
-1.697
-5.17%
jan 1, 2014
25.5
-5.658
-18.16%
jan 1, 2015
22.211
-3.289
-12.9%
jan 1, 2016
22.987
+0.777
3.5%
jan 1, 2017
22.397
-0.59
-2.57%
Ranking of countries by current statistics by years