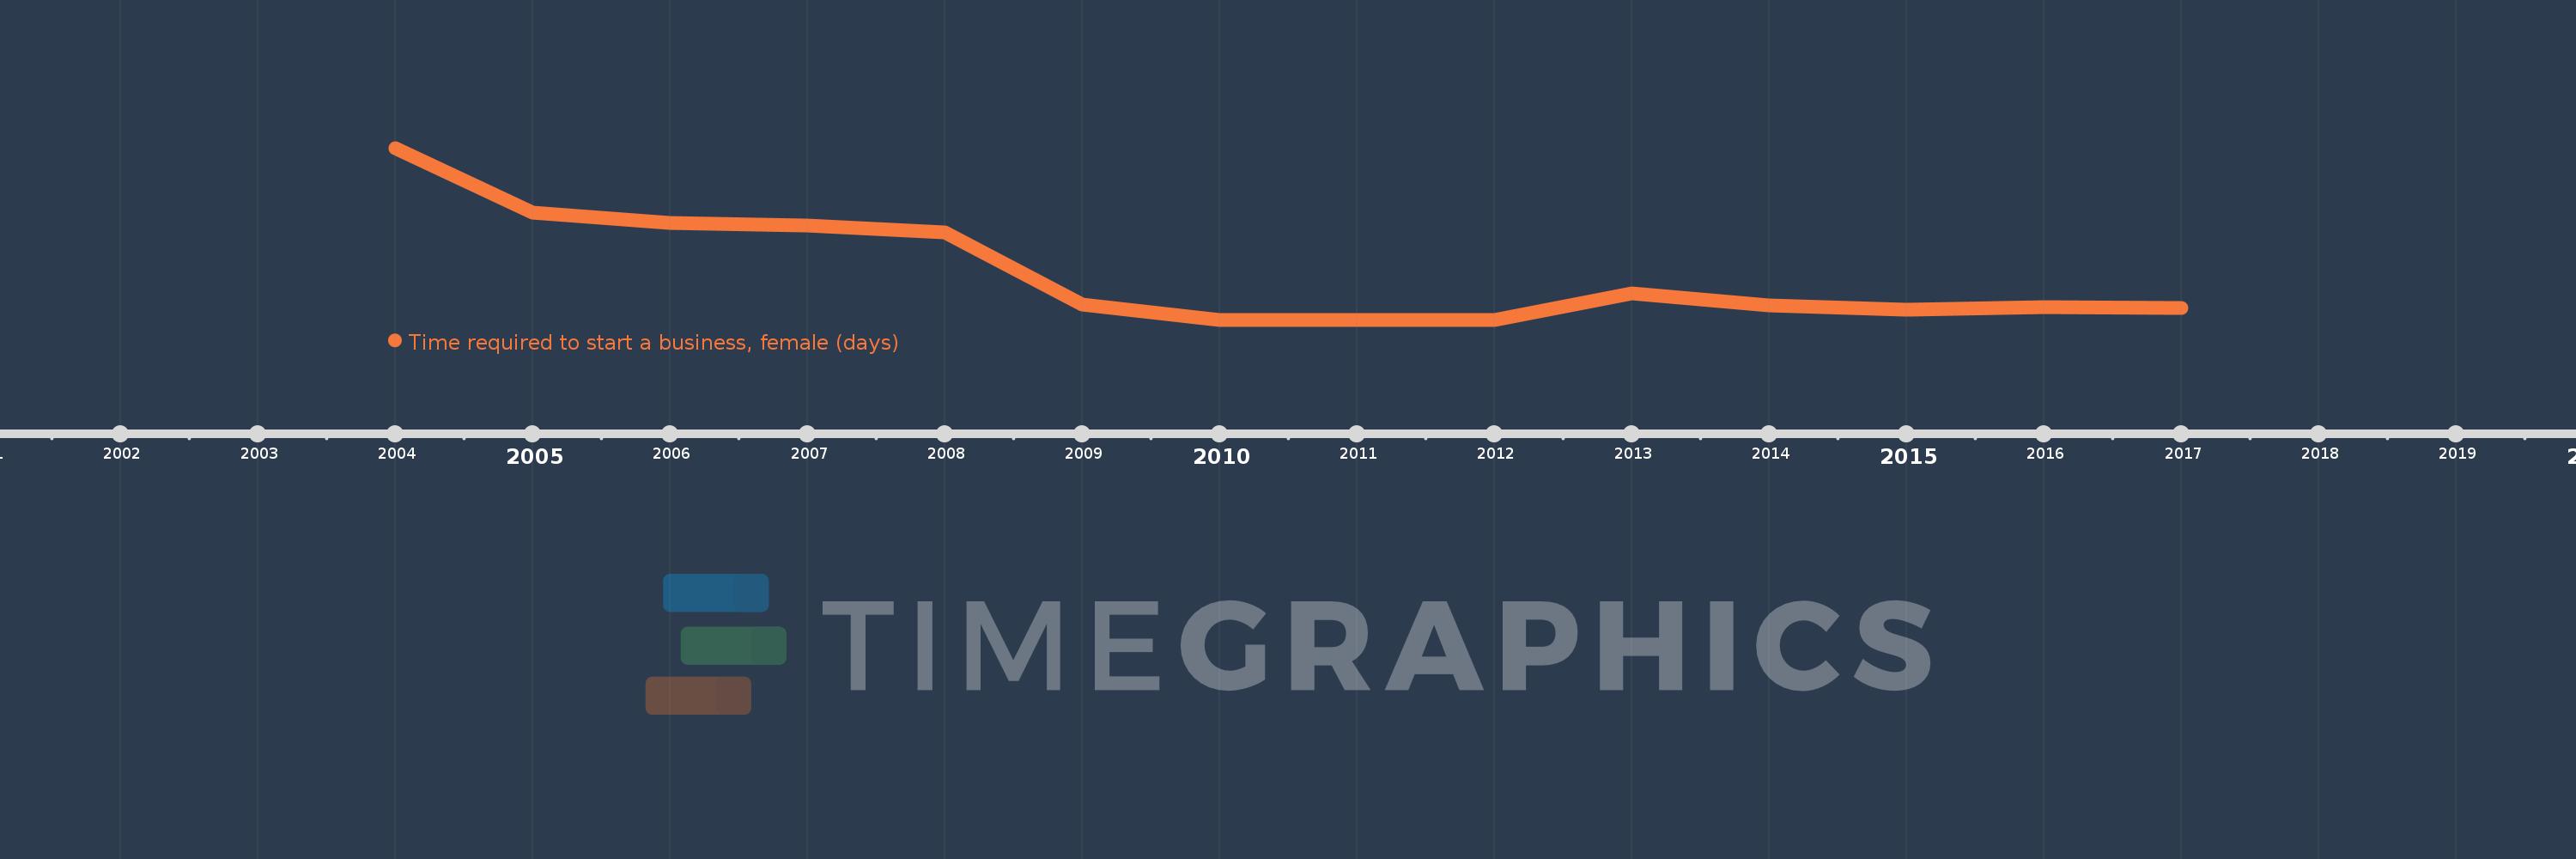
This timeline shows a graph from 2004 to 2017 of Middle East & North Africa (IDA & IBRD countries). No data until 2003. Number of actual observations by date: 14.
Source name:
World Development Indicators
Source organization:
World Bank, Doing Business project (http://www.doingbusiness.org/).
Categories, topics:
Private Sector
Last updated:
apr 23, 2017
Indicators value changes by year
Meaning:
24.547
Minimum:
17.545
jan 1, 2010
Maximum:
43.556
jan 1, 2004
At the date of observation
Value
Absolute change
Change from the previous value
jan 1, 2004
43.556
+43.556
0.0%
jan 1, 2005
33.7
-9.856
-22.63%
jan 1, 2006
32.182
-1.518
-4.5%
jan 1, 2007
31.818
-0.364
-1.13%
jan 1, 2008
30.818
-1.0
-3.14%
jan 1, 2009
19.818
-11.0
-35.69%
jan 1, 2010
17.545
-2.273
-11.47%
jan 1, 2011
17.545
0.0
0.0%
jan 1, 2012
17.545
0.0
0.0%
jan 1, 2013
21.5
+3.955
22.54%
jan 1, 2014
19.75
-1.75
-8.14%
jan 1, 2015
19.083
-0.667
-3.38%
jan 1, 2016
19.417
+0.333
1.75%
jan 1, 2017
19.375
-0.042
-0.21%
Ranking of countries by current statistics by years