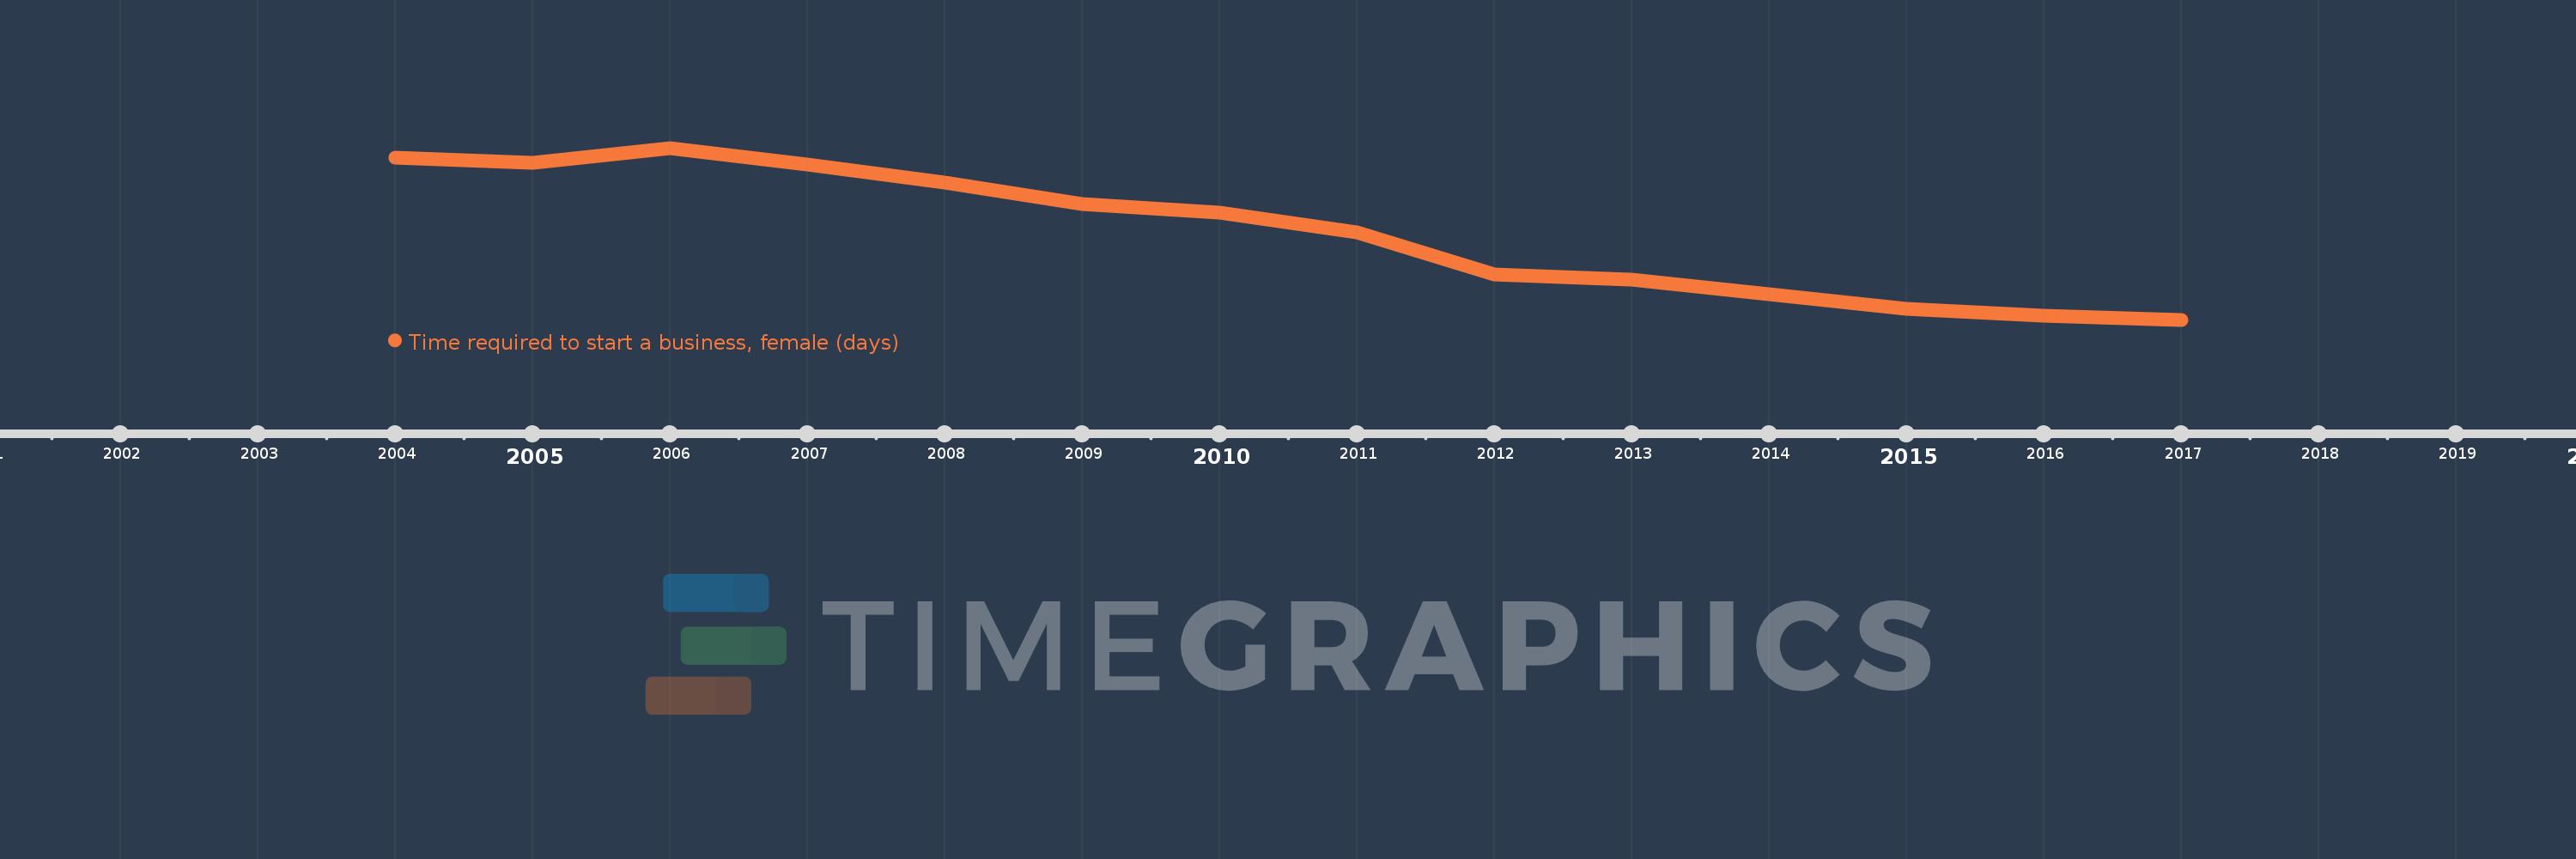
This timeline shows a graph from 2004 to 2017 of Least developed countries: UN classification. No data until 2003. Number of actual observations by date: 14.
Source name:
World Development Indicators
Source organization:
World Bank, Doing Business project (http://www.doingbusiness.org/).
Categories, topics:
Private Sector
Last updated:
apr 23, 2017
Indicators value changes by year
Meaning:
48.262
Minimum:
26.872
jan 1, 2017
Maximum:
69.081
jan 1, 2006
At the date of observation
Value
Absolute change
Change from the previous value
jan 1, 2004
66.606
+66.606
0.0%
jan 1, 2005
65.408
-1.198
-1.8%
jan 1, 2006
69.081
+3.674
5.62%
jan 1, 2007
64.966
-4.115
-5.96%
jan 1, 2008
60.67
-4.295
-6.61%
jan 1, 2009
55.375
-5.295
-8.73%
jan 1, 2010
53.17
-2.205
-3.98%
jan 1, 2011
48.33
-4.841
-9.1%
jan 1, 2012
37.932
-10.398
-21.51%
jan 1, 2013
36.728
-1.204
-3.17%
jan 1, 2014
33.039
-3.689
-10.04%
jan 1, 2015
29.62
-3.42
-10.35%
jan 1, 2016
27.872
-1.747
-5.9%
jan 1, 2017
26.872
-1.0
-3.59%
Ranking of countries by current statistics by years