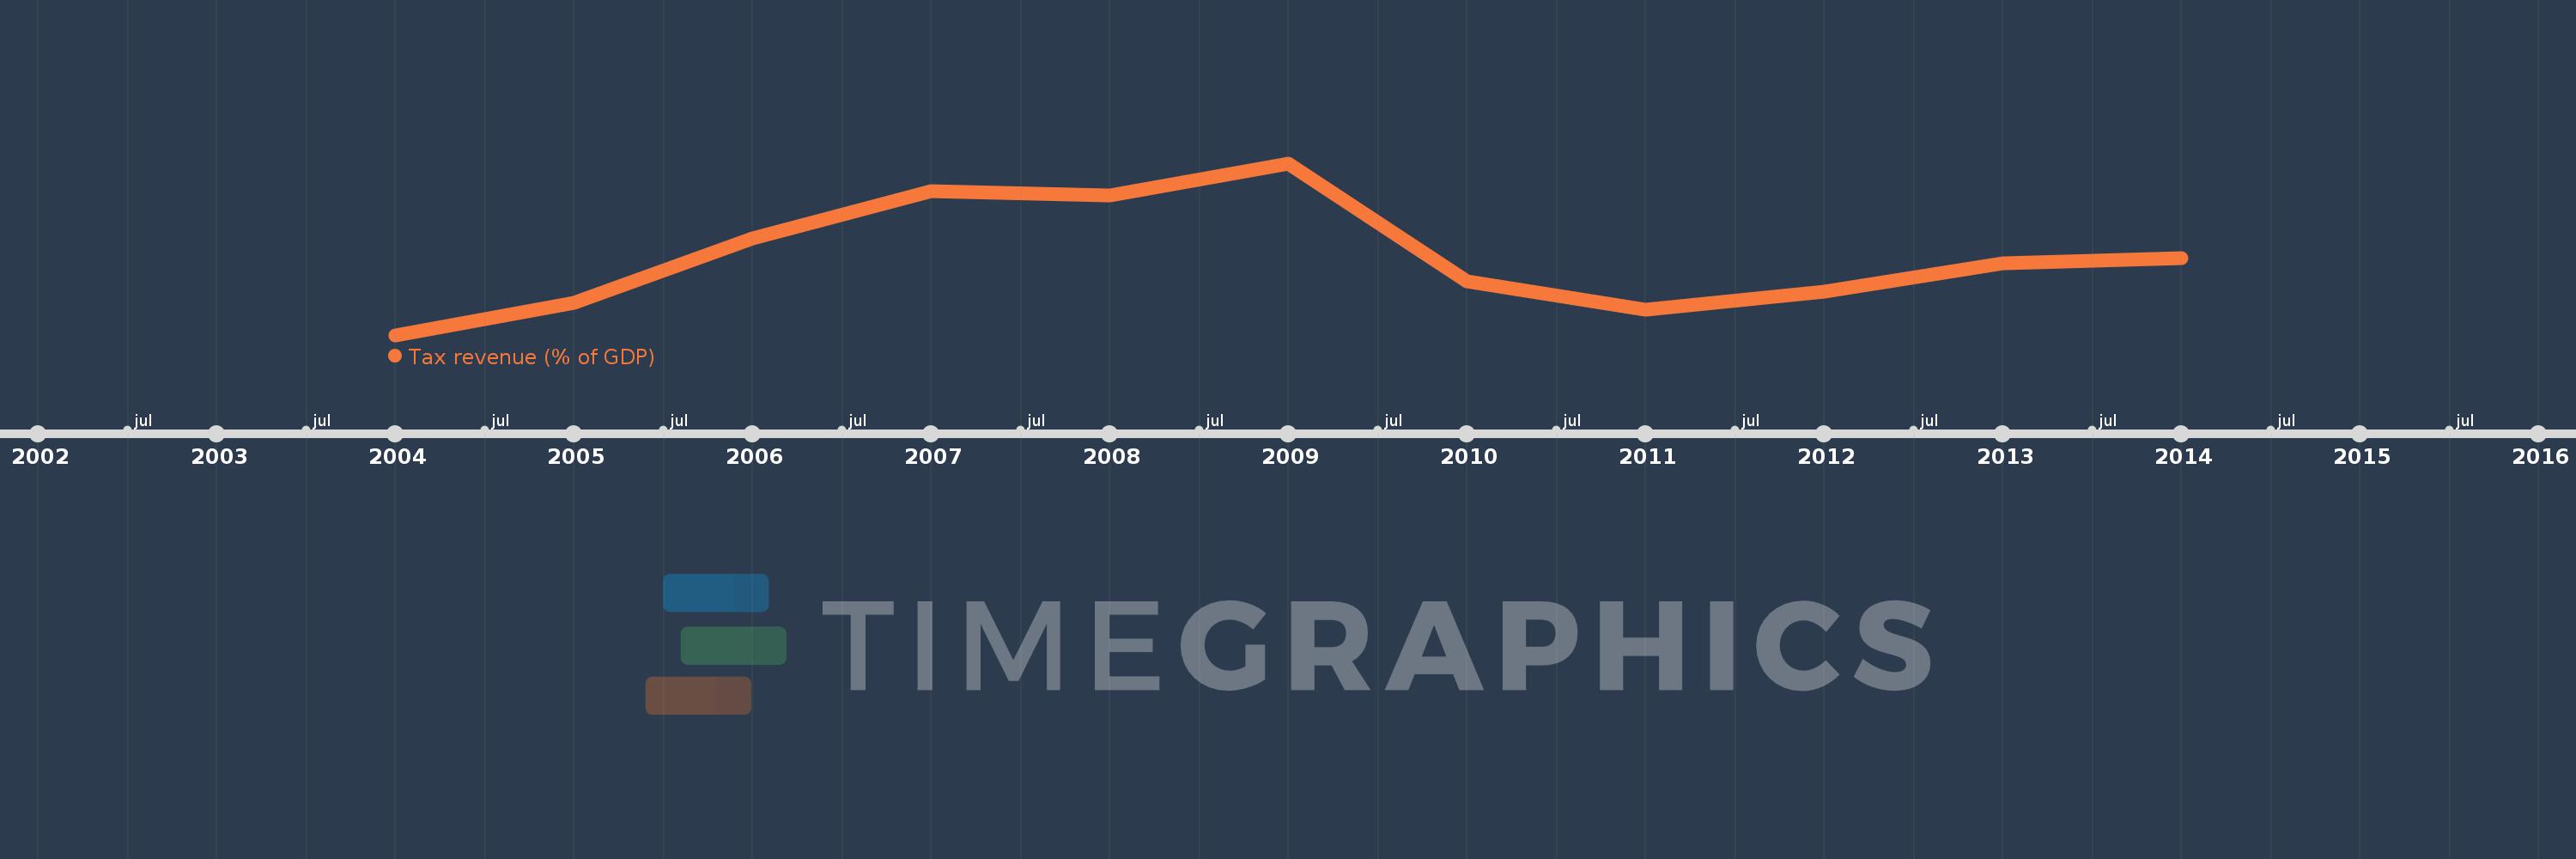
This timeline shows a graph from 2004 to 2014 of Sub-Saharan Africa (IDA & IBRD countries). No data until 2003. Number of actual observations by date: 11.
Source name:
World Development Indicators
Source organization:
International Monetary Fund, Government Finance Statistics Yearbook and data files, and World Bank and OECD GDP estimates.
Categories, topics:
Public Sector
Last updated:
apr 23, 2017
Indicators value changes by year
Meaning:
15.853
Minimum:
14.485
jan 1, 2004
Maximum:
17.506
jan 1, 2009
At the date of observation
Value
Absolute change
Change from the previous value
jan 1, 2004
14.485
+14.485
0.0%
jan 1, 2005
15.056
+0.571
3.94%
jan 1, 2006
16.188
+1.132
7.52%
jan 1, 2007
17.016
+0.828
5.12%
jan 1, 2008
16.944
-0.072
-0.42%
jan 1, 2009
17.506
+0.562
3.31%
jan 1, 2010
15.435
-2.071
-11.83%
jan 1, 2011
14.93
-0.505
-3.27%
jan 1, 2012
15.245
+0.314
2.11%
jan 1, 2013
15.746
+0.501
3.29%
jan 1, 2014
15.83
+0.084
0.54%
Ranking of countries by current statistics by years