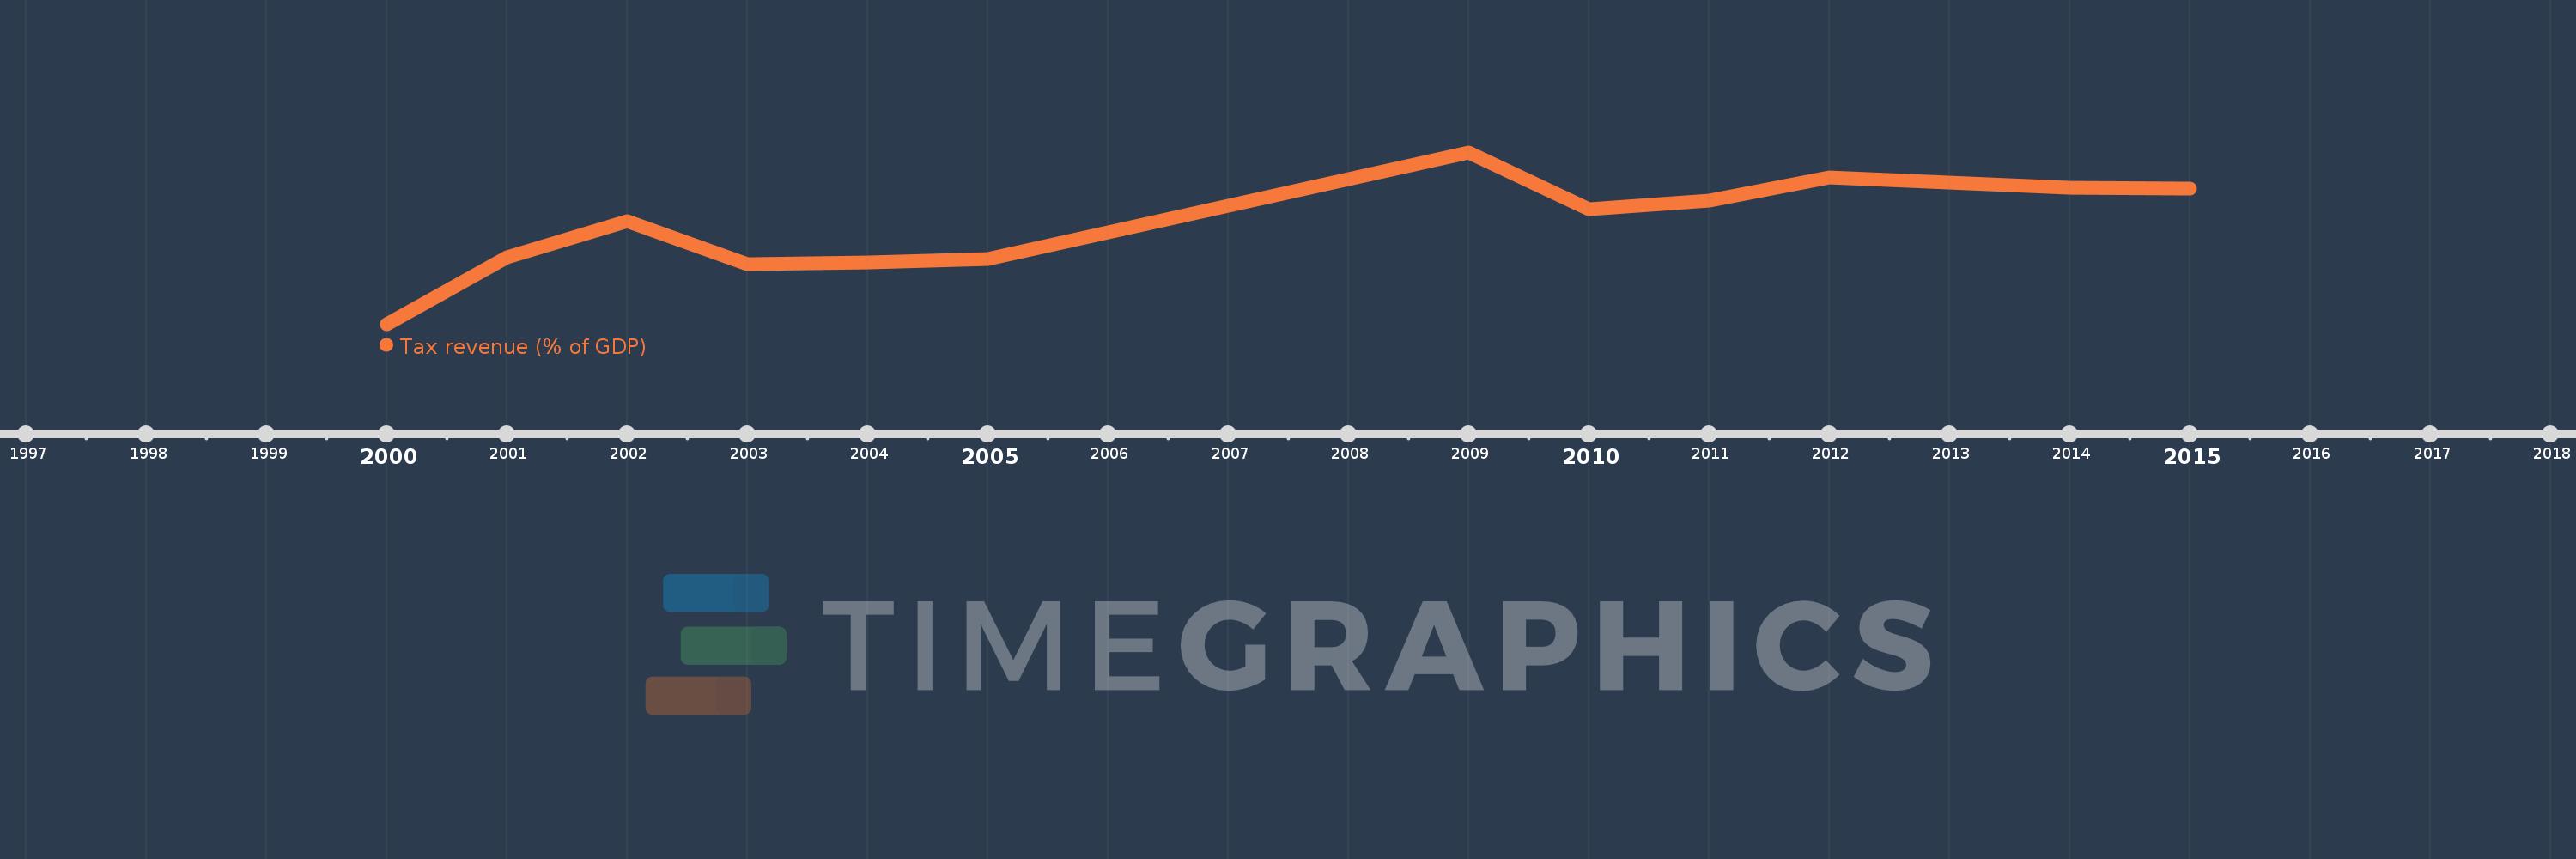
This timeline shows a graph from 2000 to 2015 of Europe & Central Asia (excluding high income). No data until 1999. Number of actual observations by date: 13.
Source name:
World Development Indicators
Source organization:
International Monetary Fund, Government Finance Statistics Yearbook and data files, and World Bank and OECD GDP estimates.
Categories, topics:
Public Sector
Last updated:
apr 23, 2017
Indicators value changes by year
Meaning:
15.112
Minimum:
11.959
jan 1, 2000
Maximum:
17.257
jan 1, 2009
At the date of observation
Value
Absolute change
Change from the previous value
jan 1, 2000
11.959
+11.959
0.0%
jan 1, 2001
14.025
+2.066
17.28%
jan 1, 2002
15.146
+1.121
7.99%
jan 1, 2003
13.816
-1.33
-8.78%
jan 1, 2004
13.876
+0.06
0.44%
jan 1, 2005
13.959
+0.082
0.59%
jan 1, 2009
17.257
+3.298
23.63%
jan 1, 2010
15.496
-1.76
-10.2%
jan 1, 2011
15.781
+0.285
1.84%
jan 1, 2012
16.492
+0.71
4.5%
jan 1, 2013
16.331
-0.161
-0.97%
jan 1, 2014
16.174
-0.157
-0.96%
jan 1, 2015
16.138
-0.036
-0.22%
Ranking of countries by current statistics by years