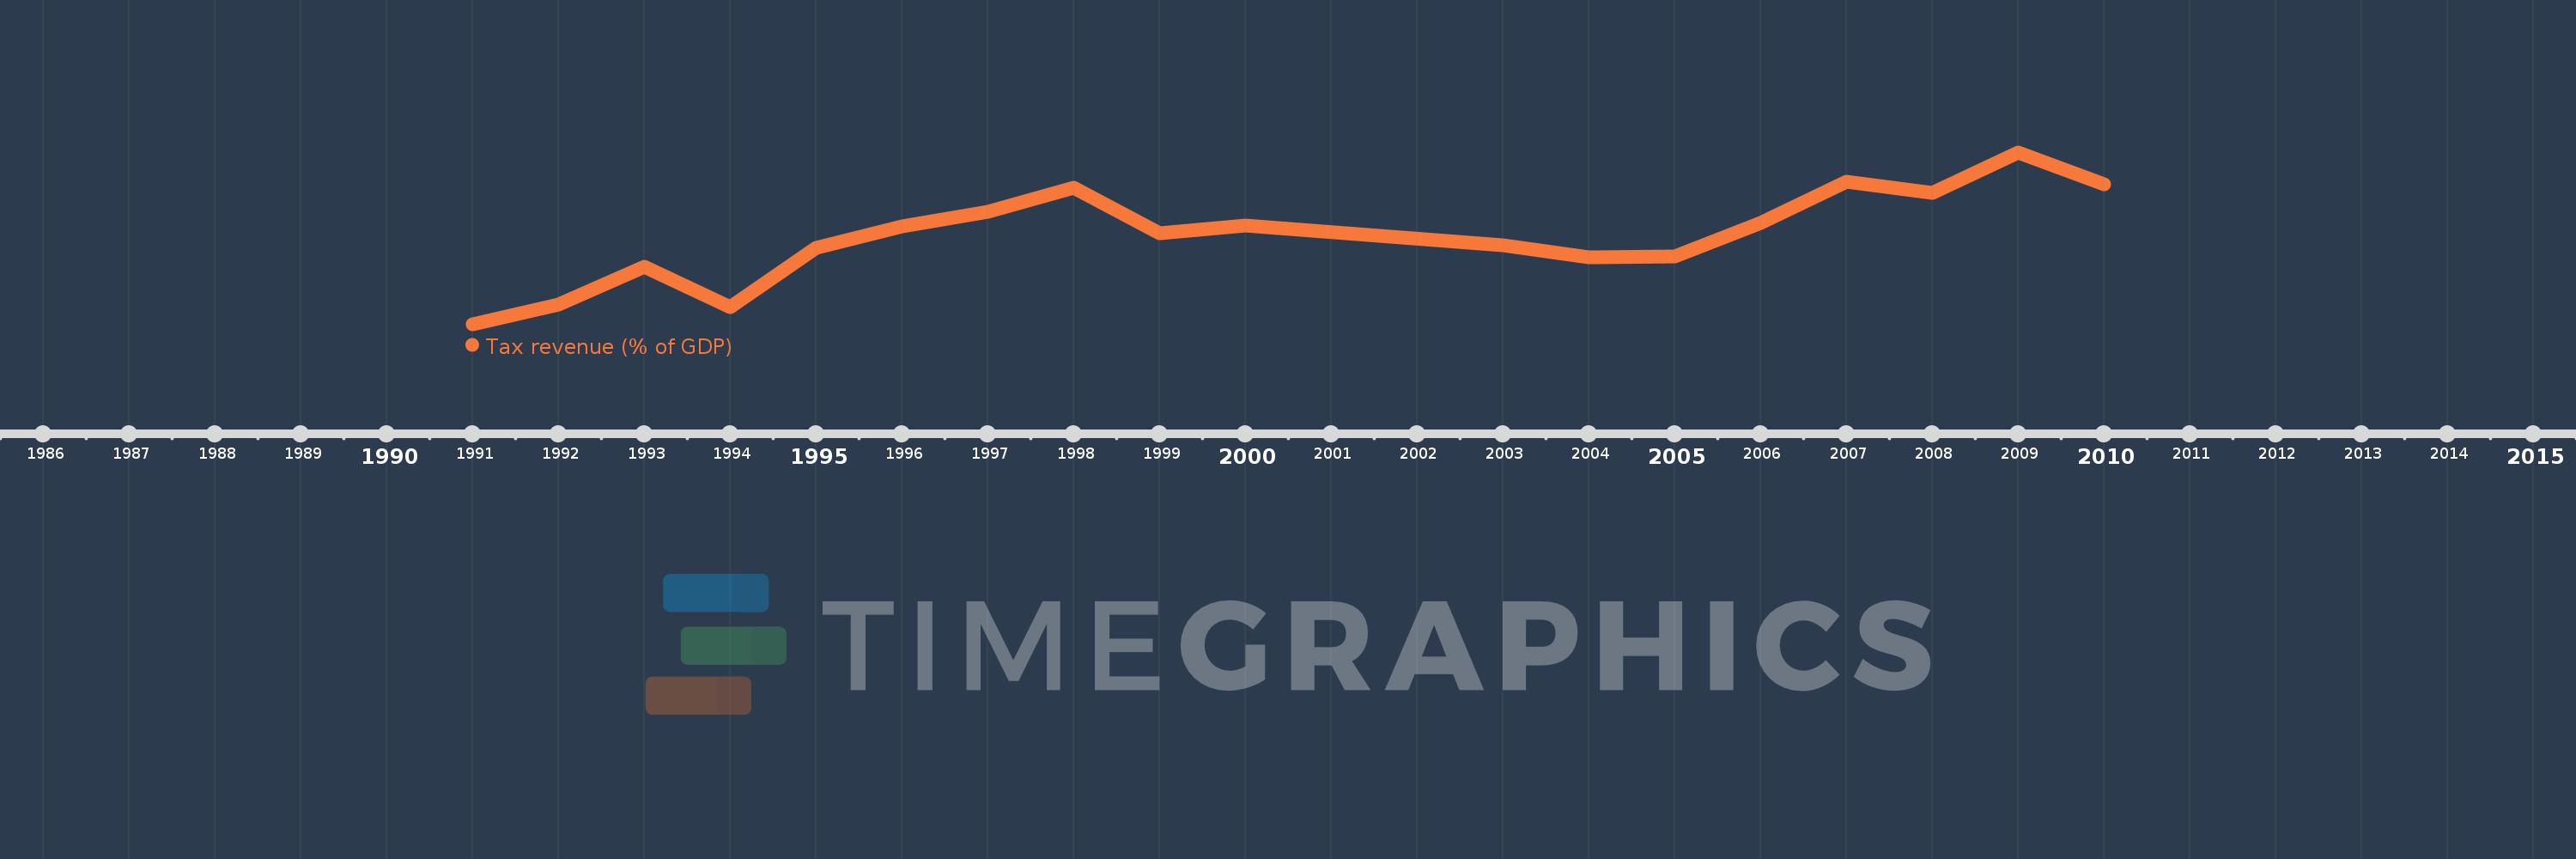
This timeline shows a graph from 1991 to 2010 of Middle East & North Africa (IDA & IBRD countries). No data until 1990. Number of actual observations by date: 18.
Source name:
World Development Indicators
Source organization:
International Monetary Fund, Government Finance Statistics Yearbook and data files, and World Bank and OECD GDP estimates.
Categories, topics:
Public Sector
Last updated:
apr 23, 2017
Indicators value changes by year
Meaning:
14.184
Minimum:
10.524
jan 1, 1991
Maximum:
17.559
jan 1, 2009
At the date of observation
Value
Absolute change
Change from the previous value
jan 1, 1991
10.524
+10.524
0.0%
jan 1, 1992
11.345
+0.821
7.81%
jan 1, 1993
12.865
+1.52
13.39%
jan 1, 1994
11.212
-1.653
-12.85%
jan 1, 1995
13.666
+2.454
21.89%
jan 1, 1996
14.527
+0.862
6.3%
jan 1, 1997
15.142
+0.615
4.23%
jan 1, 1998
16.103
+0.961
6.35%
jan 1, 1999
14.266
-1.837
-11.41%
jan 1, 2000
14.58
+0.314
2.2%
jan 1, 2003
13.758
-0.821
-5.63%
jan 1, 2004
13.269
-0.489
-3.56%
jan 1, 2005
13.307
+0.039
0.29%
jan 1, 2006
14.658
+1.351
10.15%
jan 1, 2007
16.374
+1.716
11.71%
jan 1, 2008
15.901
-0.473
-2.89%
jan 1, 2009
17.559
+1.658
10.43%
jan 1, 2010
16.248
-1.311
-7.46%
Ranking of countries by current statistics by years