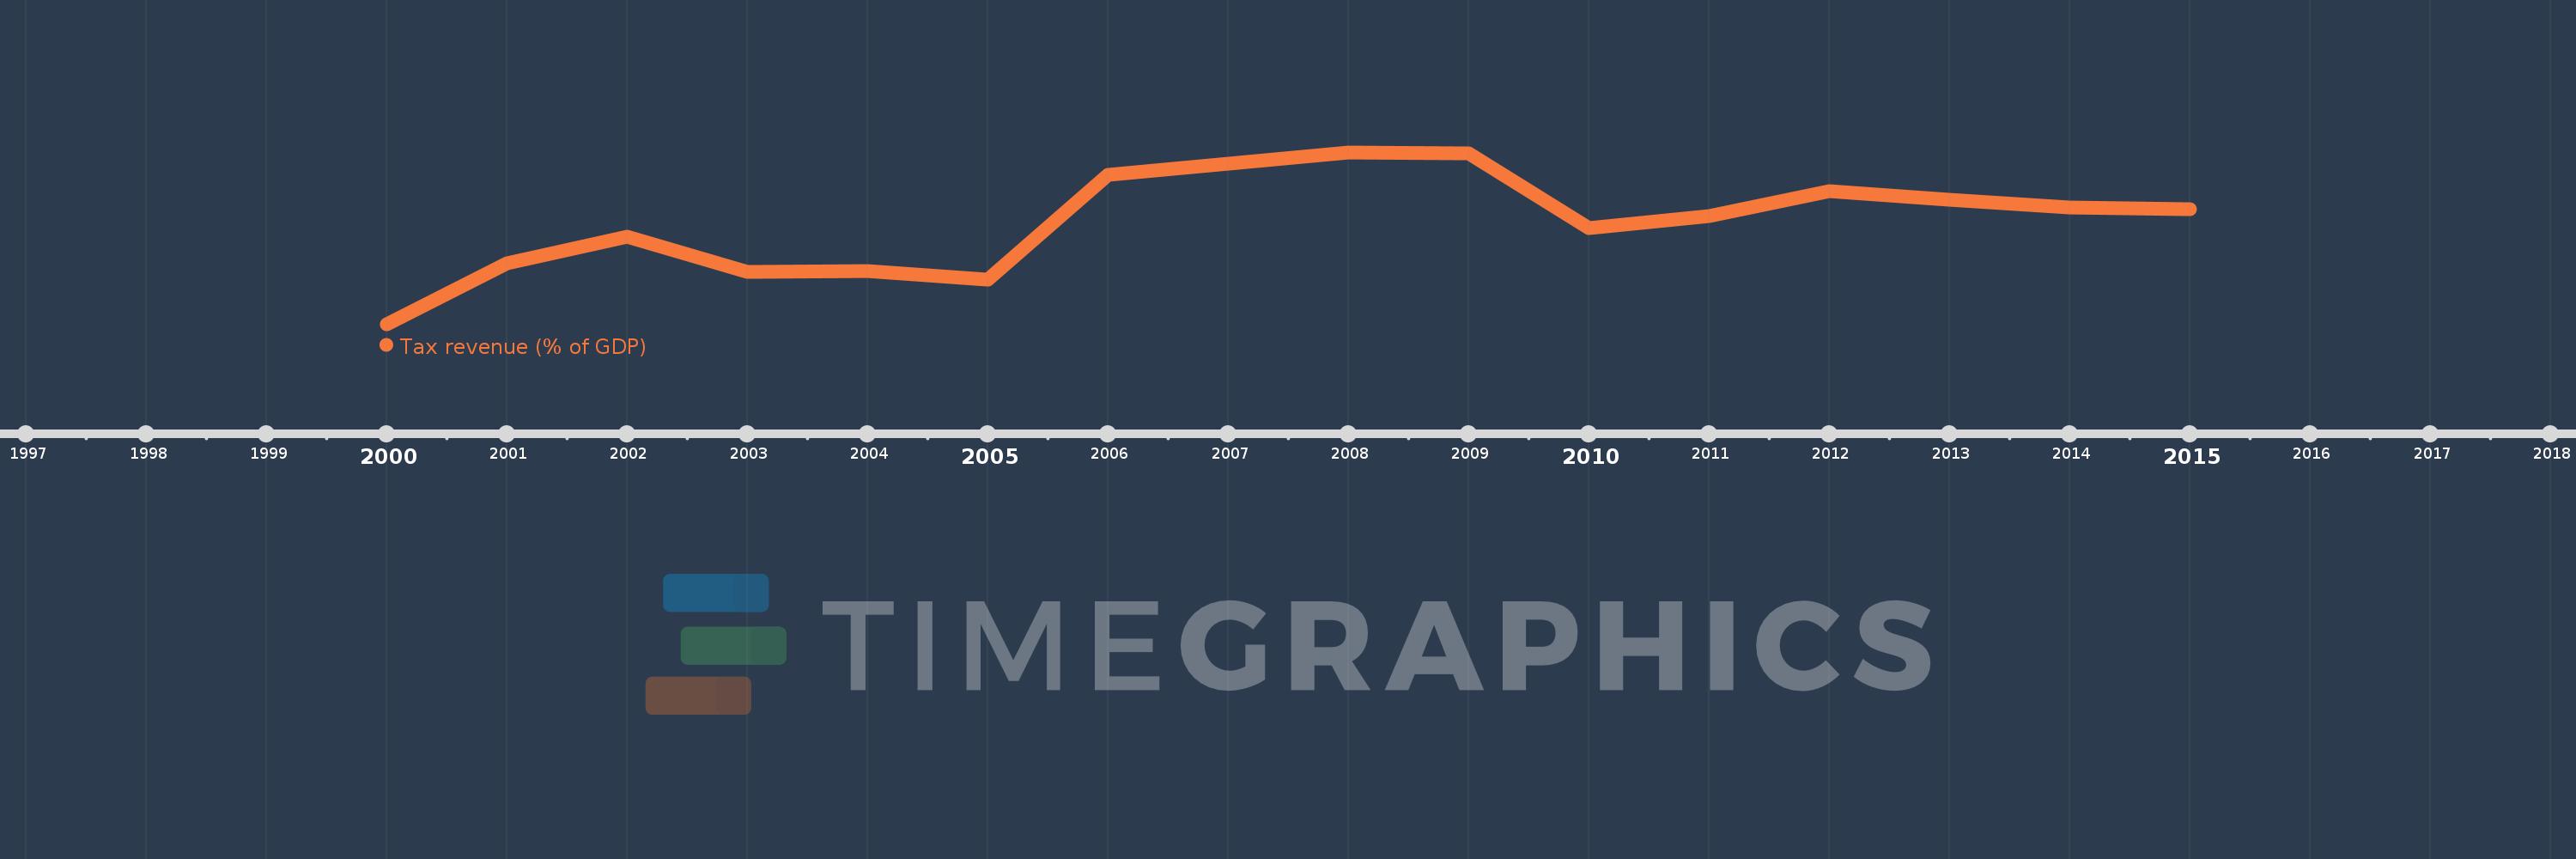
This timeline shows a graph from 2000 to 2015 of Europe & Central Asia (IDA & IBRD countries). No data until 1999. Number of actual observations by date: 16.
Source name:
World Development Indicators
Source organization:
International Monetary Fund, Government Finance Statistics Yearbook and data files, and World Bank and OECD GDP estimates.
Categories, topics:
Public Sector
Last updated:
apr 23, 2017
Indicators value changes by year
Meaning:
15.805
Minimum:
13.326
jan 1, 2000
Maximum:
17.471
jan 1, 2008
At the date of observation
Value
Absolute change
Change from the previous value
jan 1, 2000
13.326
+13.326
0.0%
jan 1, 2001
14.787
+1.462
10.97%
jan 1, 2002
15.442
+0.654
4.43%
jan 1, 2003
14.596
-0.846
-5.48%
jan 1, 2004
14.611
+0.016
0.11%
jan 1, 2005
14.4
-0.211
-1.45%
jan 1, 2006
16.938
+2.538
17.62%
jan 1, 2007
17.196
+0.258
1.52%
jan 1, 2008
17.471
+0.275
1.6%
jan 1, 2009
17.442
-0.029
-0.17%
jan 1, 2010
15.641
-1.801
-10.32%
jan 1, 2011
15.927
+0.286
1.83%
jan 1, 2012
16.542
+0.615
3.86%
jan 1, 2013
16.329
-0.214
-1.29%
jan 1, 2014
16.135
-0.194
-1.19%
jan 1, 2015
16.096
-0.038
-0.24%
Ranking of countries by current statistics by years