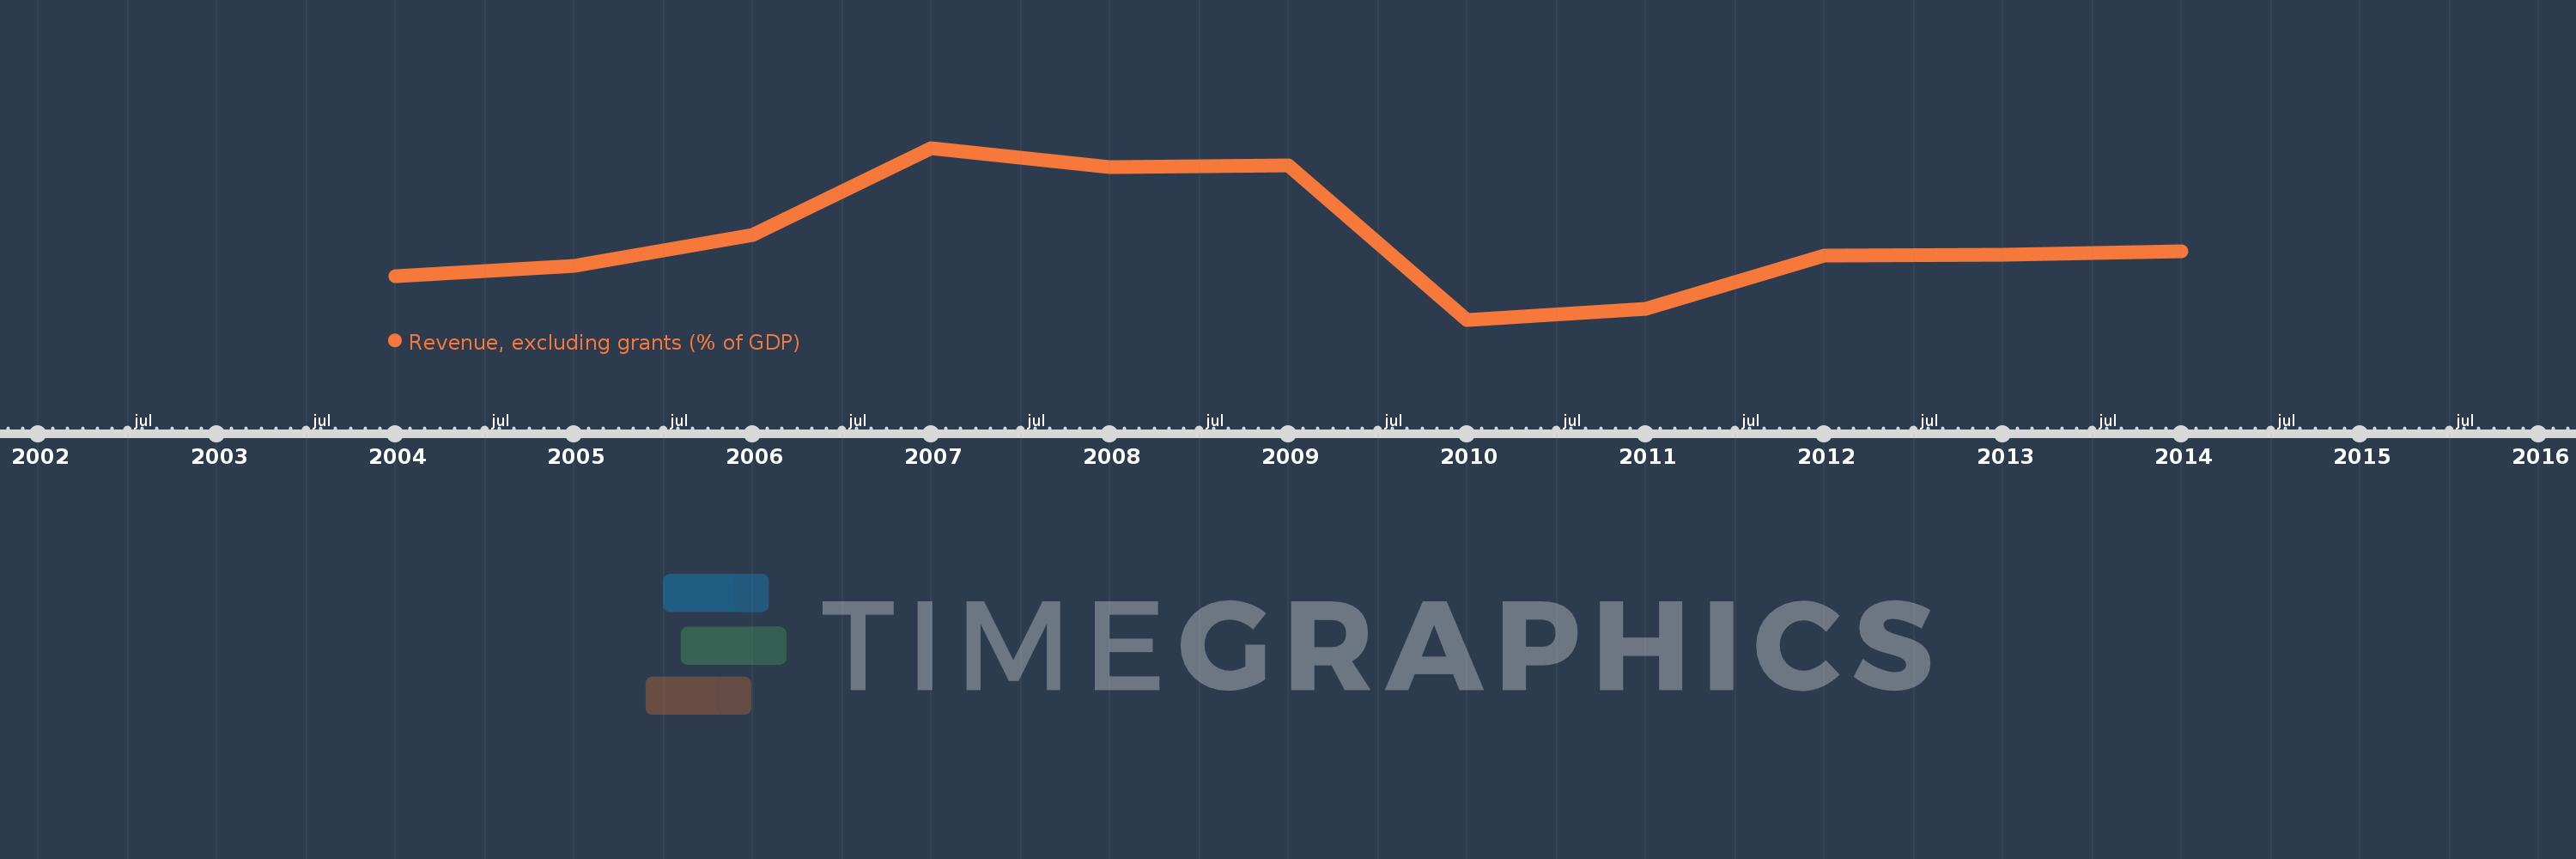
This timeline shows a graph from 2004 to 2014 of Sub-Saharan Africa (IDA & IBRD countries). No data until 2003. Number of actual observations by date: 11.
Source name:
World Development Indicators
Source organization:
International Monetary Fund, Government Finance Statistics Yearbook and data files, and World Bank and OECD GDP estimates.
Categories, topics:
Economy & Growth, Public Sector
Last updated:
apr 23, 2017
Indicators value changes by year
Meaning:
21.173
Minimum:
19.095
jan 1, 2010
Maximum:
23.608
jan 1, 2007
At the date of observation
Value
Absolute change
Change from the previous value
jan 1, 2004
20.243
+20.243
0.0%
jan 1, 2005
20.513
+0.27
1.33%
jan 1, 2006
21.333
+0.82
4.0%
jan 1, 2007
23.608
+2.274
10.66%
jan 1, 2008
23.102
-0.505
-2.14%
jan 1, 2009
23.153
+0.051
0.22%
jan 1, 2010
19.095
-4.058
-17.53%
jan 1, 2011
19.376
+0.28
1.47%
jan 1, 2012
20.786
+1.411
7.28%
jan 1, 2013
20.806
+0.02
0.1%
jan 1, 2014
20.886
+0.08
0.38%
Ranking of countries by current statistics by years