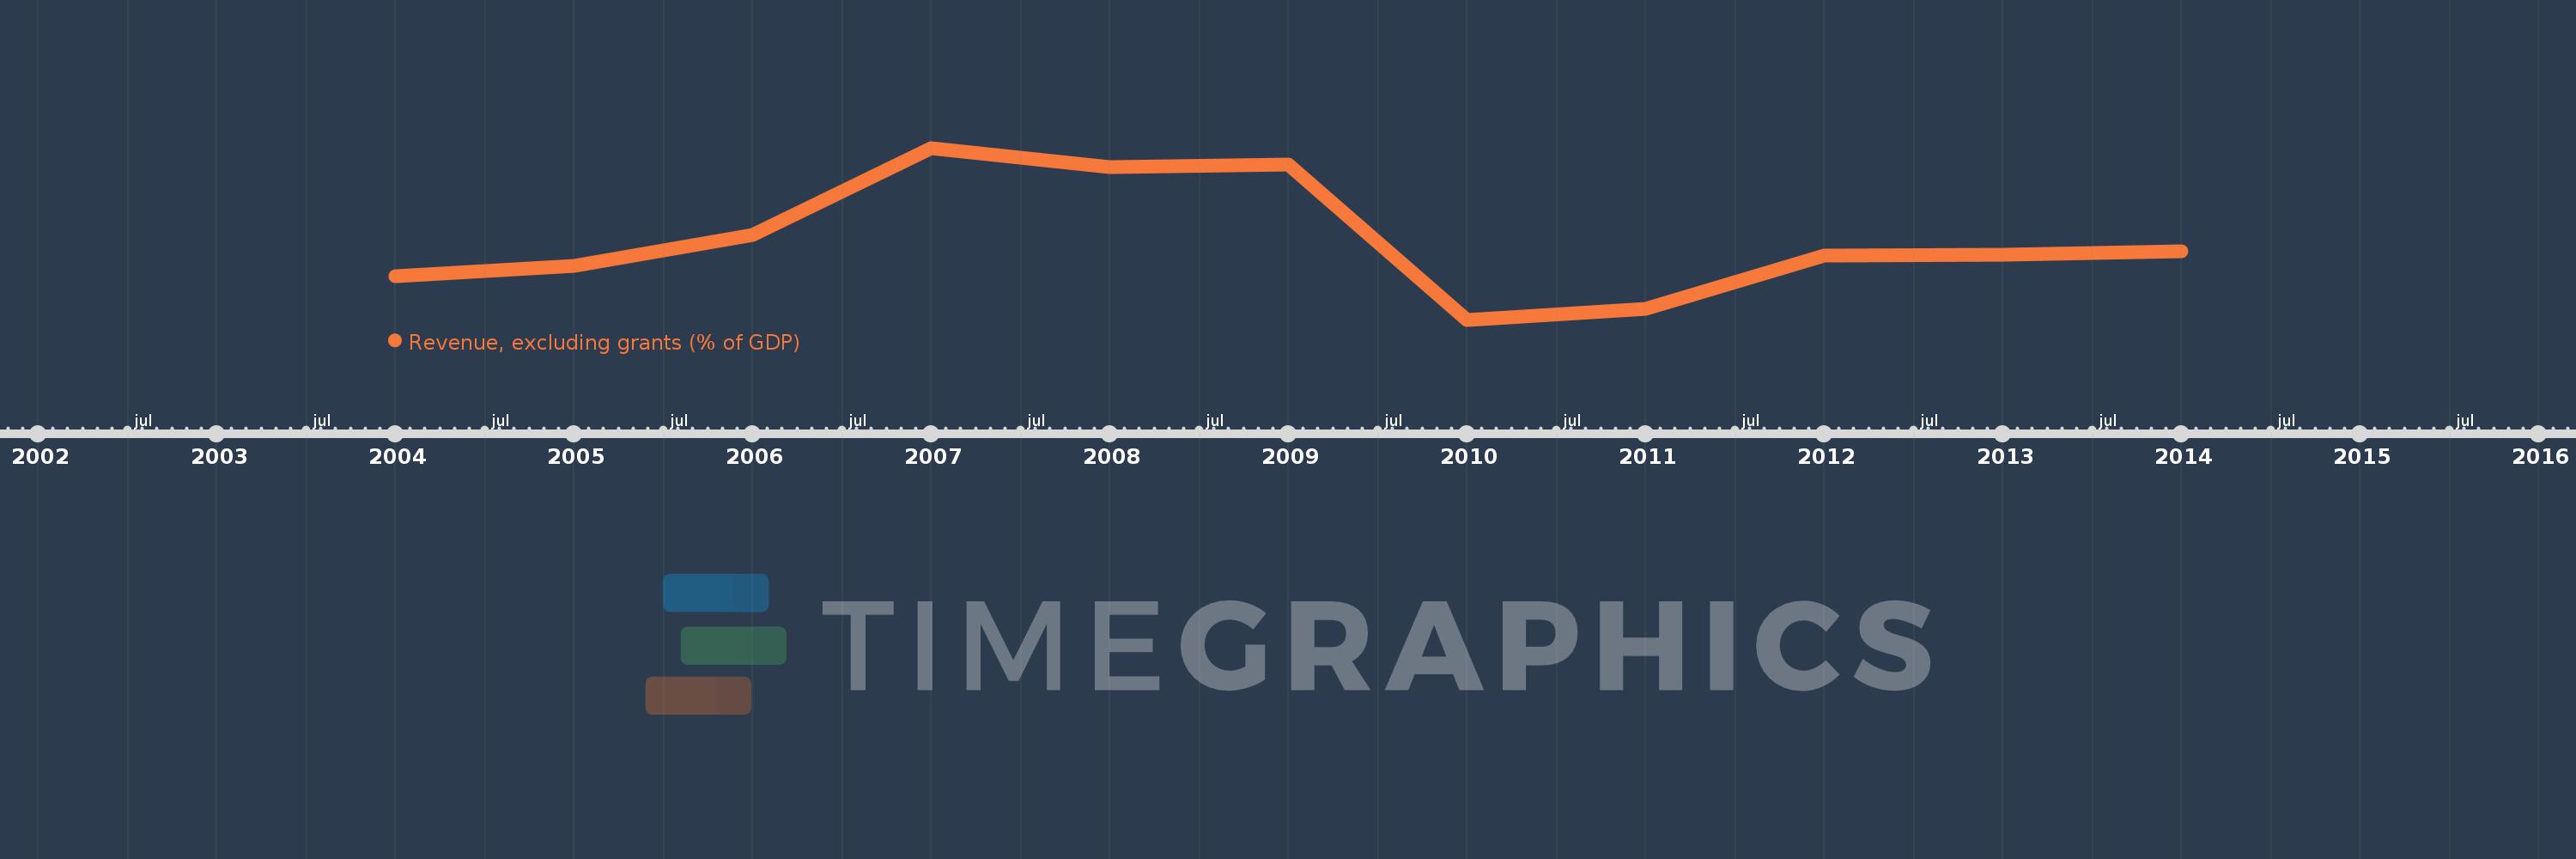
This timeline shows a graph from 2004 to 2014 of Sub-Saharan Africa (excluding high income). No data until 2003. Number of actual observations by date: 11.
Source name:
World Development Indicators
Source organization:
International Monetary Fund, Government Finance Statistics Yearbook and data files, and World Bank and OECD GDP estimates.
Categories, topics:
Economy & Growth, Public Sector
Last updated:
apr 23, 2017
Indicators value changes by year
Meaning:
21.156
Minimum:
19.082
jan 1, 2010
Maximum:
23.584
jan 1, 2007
At the date of observation
Value
Absolute change
Change from the previous value
jan 1, 2004
20.217
+20.217
0.0%
jan 1, 2005
20.492
+0.275
1.36%
jan 1, 2006
21.311
+0.819
3.99%
jan 1, 2007
23.584
+2.273
10.66%
jan 1, 2008
23.09
-0.494
-2.1%
jan 1, 2009
23.142
+0.052
0.23%
jan 1, 2010
19.082
-4.059
-17.54%
jan 1, 2011
19.361
+0.278
1.46%
jan 1, 2012
20.772
+1.411
7.29%
jan 1, 2013
20.792
+0.02
0.1%
jan 1, 2014
20.874
+0.082
0.4%
Ranking of countries by current statistics by years