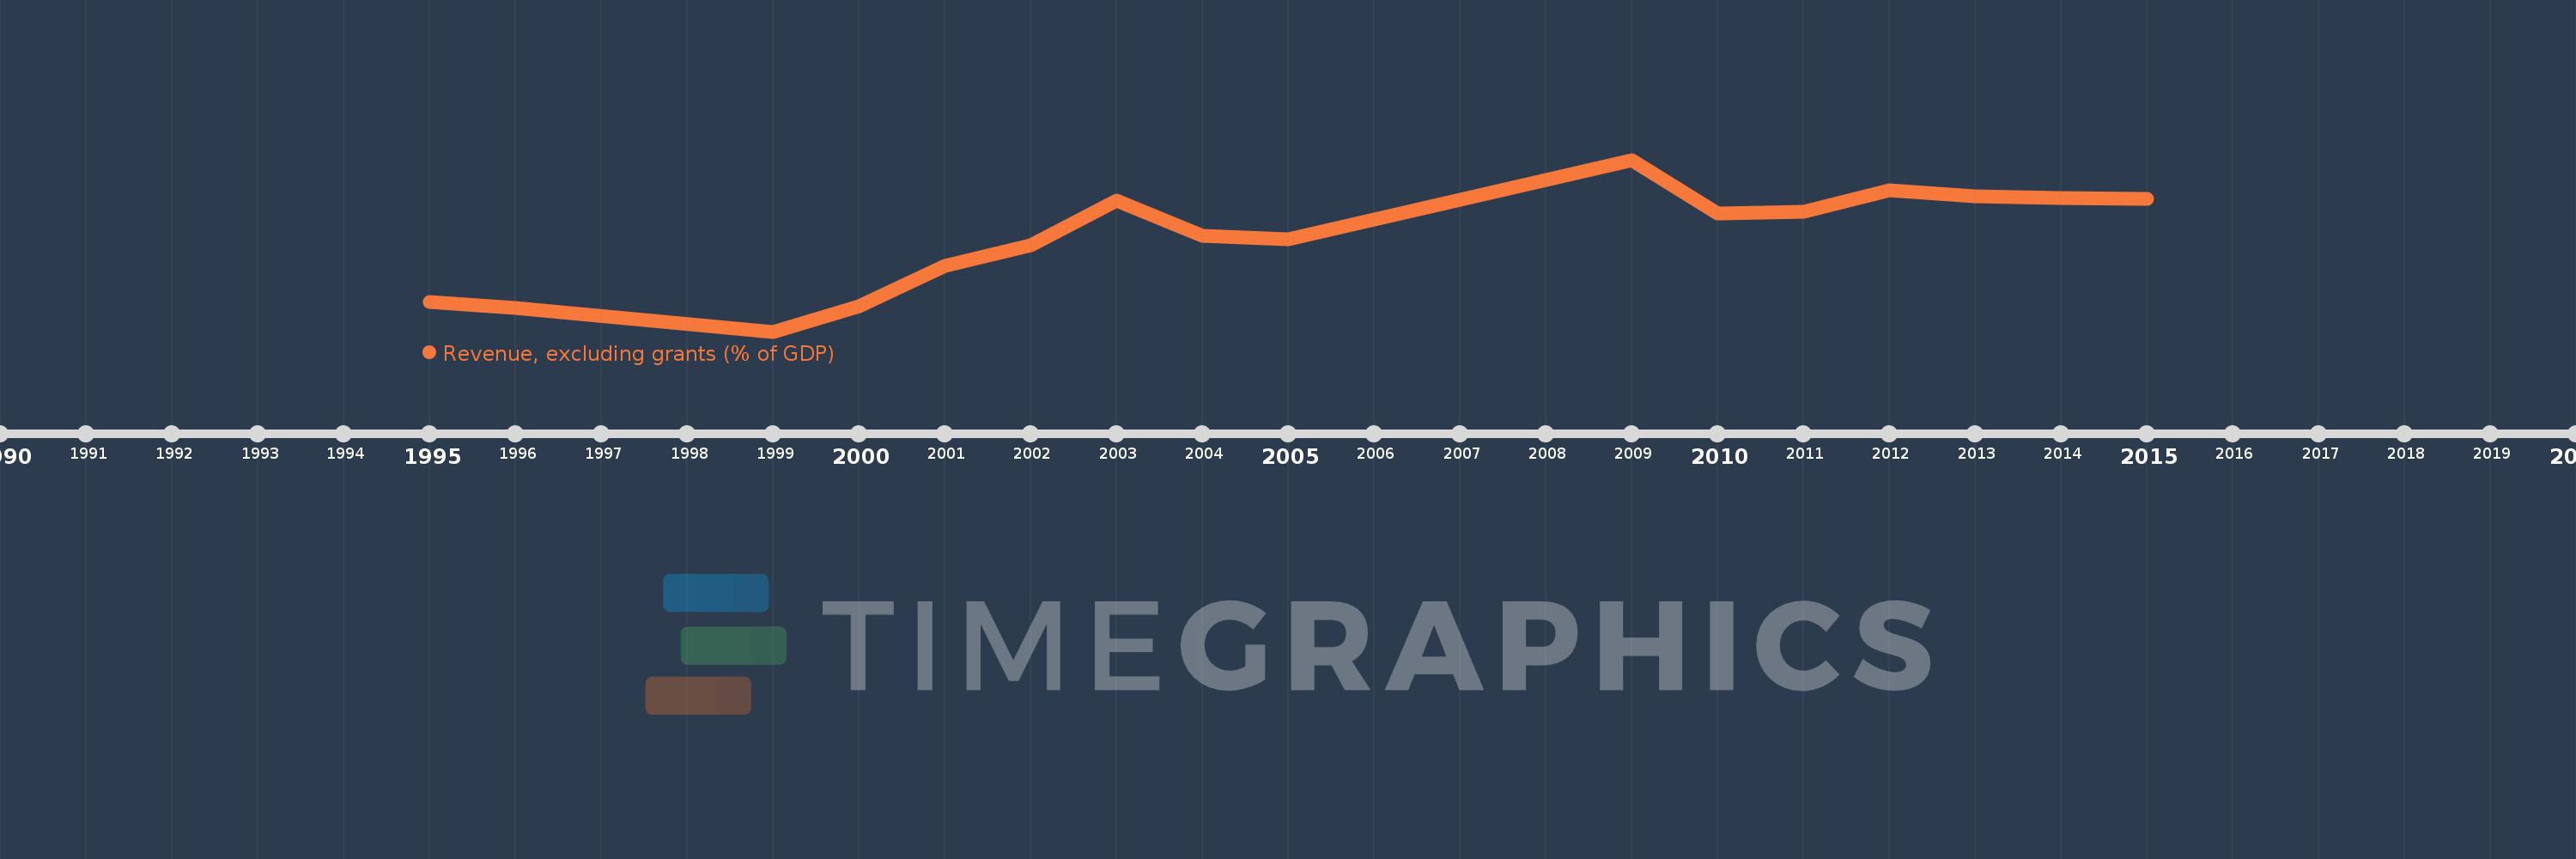
This timeline shows a graph from 1995 to 2015 of Europe & Central Asia (excluding high income). No data until 1994. Number of actual observations by date: 16.
Source name:
World Development Indicators
Source organization:
International Monetary Fund, Government Finance Statistics Yearbook and data files, and World Bank and OECD GDP estimates.
Categories, topics:
Economy & Growth, Public Sector
Last updated:
apr 23, 2017
Indicators value changes by year
Meaning:
27.029
Minimum:
19.388
jan 1, 1999
Maximum:
33.374
jan 1, 2009
At the date of observation
Value
Absolute change
Change from the previous value
jan 1, 1995
21.799
+21.799
0.0%
jan 1, 1996
21.289
-0.51
-2.34%
jan 1, 1999
19.388
-1.901
-8.93%
jan 1, 2000
21.431
+2.043
10.54%
jan 1, 2001
24.731
+3.3
15.4%
jan 1, 2002
26.416
+1.684
6.81%
jan 1, 2003
30.068
+3.653
13.83%
jan 1, 2004
27.165
-2.904
-9.66%
jan 1, 2005
26.917
-0.247
-0.91%
jan 1, 2009
33.374
+6.457
23.99%
jan 1, 2010
29.003
-4.371
-13.1%
jan 1, 2011
29.137
+0.134
0.46%
jan 1, 2012
30.874
+1.737
5.96%
jan 1, 2013
30.389
-0.485
-1.57%
jan 1, 2014
30.278
-0.111
-0.37%
jan 1, 2015
30.201
-0.076
-0.25%
Ranking of countries by current statistics by years