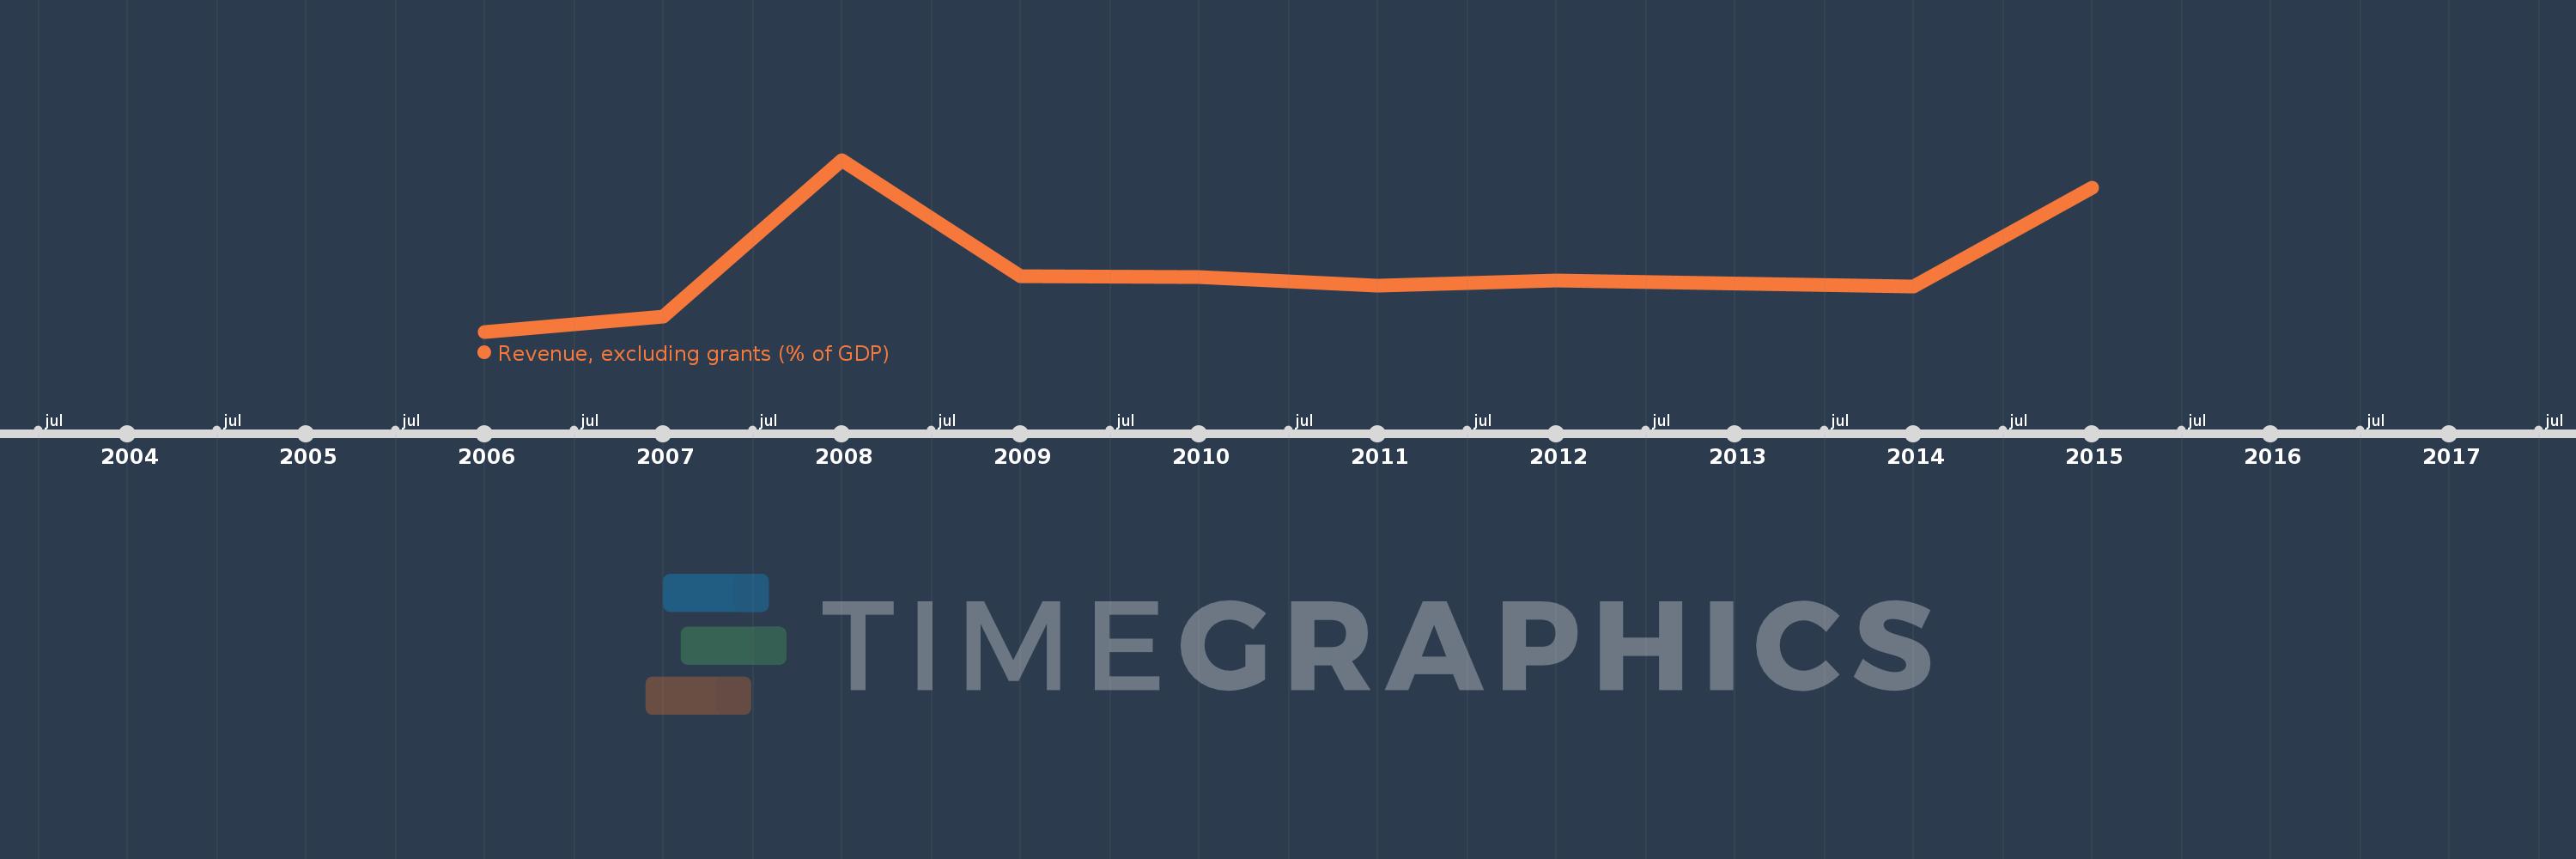
This timeline shows a graph from 2006 to 2015 of East Asia & Pacific (IDA & IBRD countries). No data until 2005. Number of actual observations by date: 9.
Source name:
World Development Indicators
Source organization:
International Monetary Fund, Government Finance Statistics Yearbook and data files, and World Bank and OECD GDP estimates.
Categories, topics:
Economy & Growth, Public Sector
Last updated:
apr 23, 2017
Indicators value changes by year
Meaning:
13.141
Minimum:
10.808
jan 1, 2006
Maximum:
17.005
jan 1, 2008
At the date of observation
Value
Absolute change
Change from the previous value
jan 1, 2006
10.808
+10.808
0.0%
jan 1, 2007
11.356
+0.548
5.07%
jan 1, 2008
17.005
+5.649
49.75%
jan 1, 2009
12.794
-4.211
-24.76%
jan 1, 2010
12.777
-0.017
-0.13%
jan 1, 2011
12.468
-0.309
-2.42%
jan 1, 2012
12.646
+0.178
1.43%
jan 1, 2014
12.423
-0.223
-1.76%
jan 1, 2015
15.992
+3.568
28.72%
Ranking of countries by current statistics by years