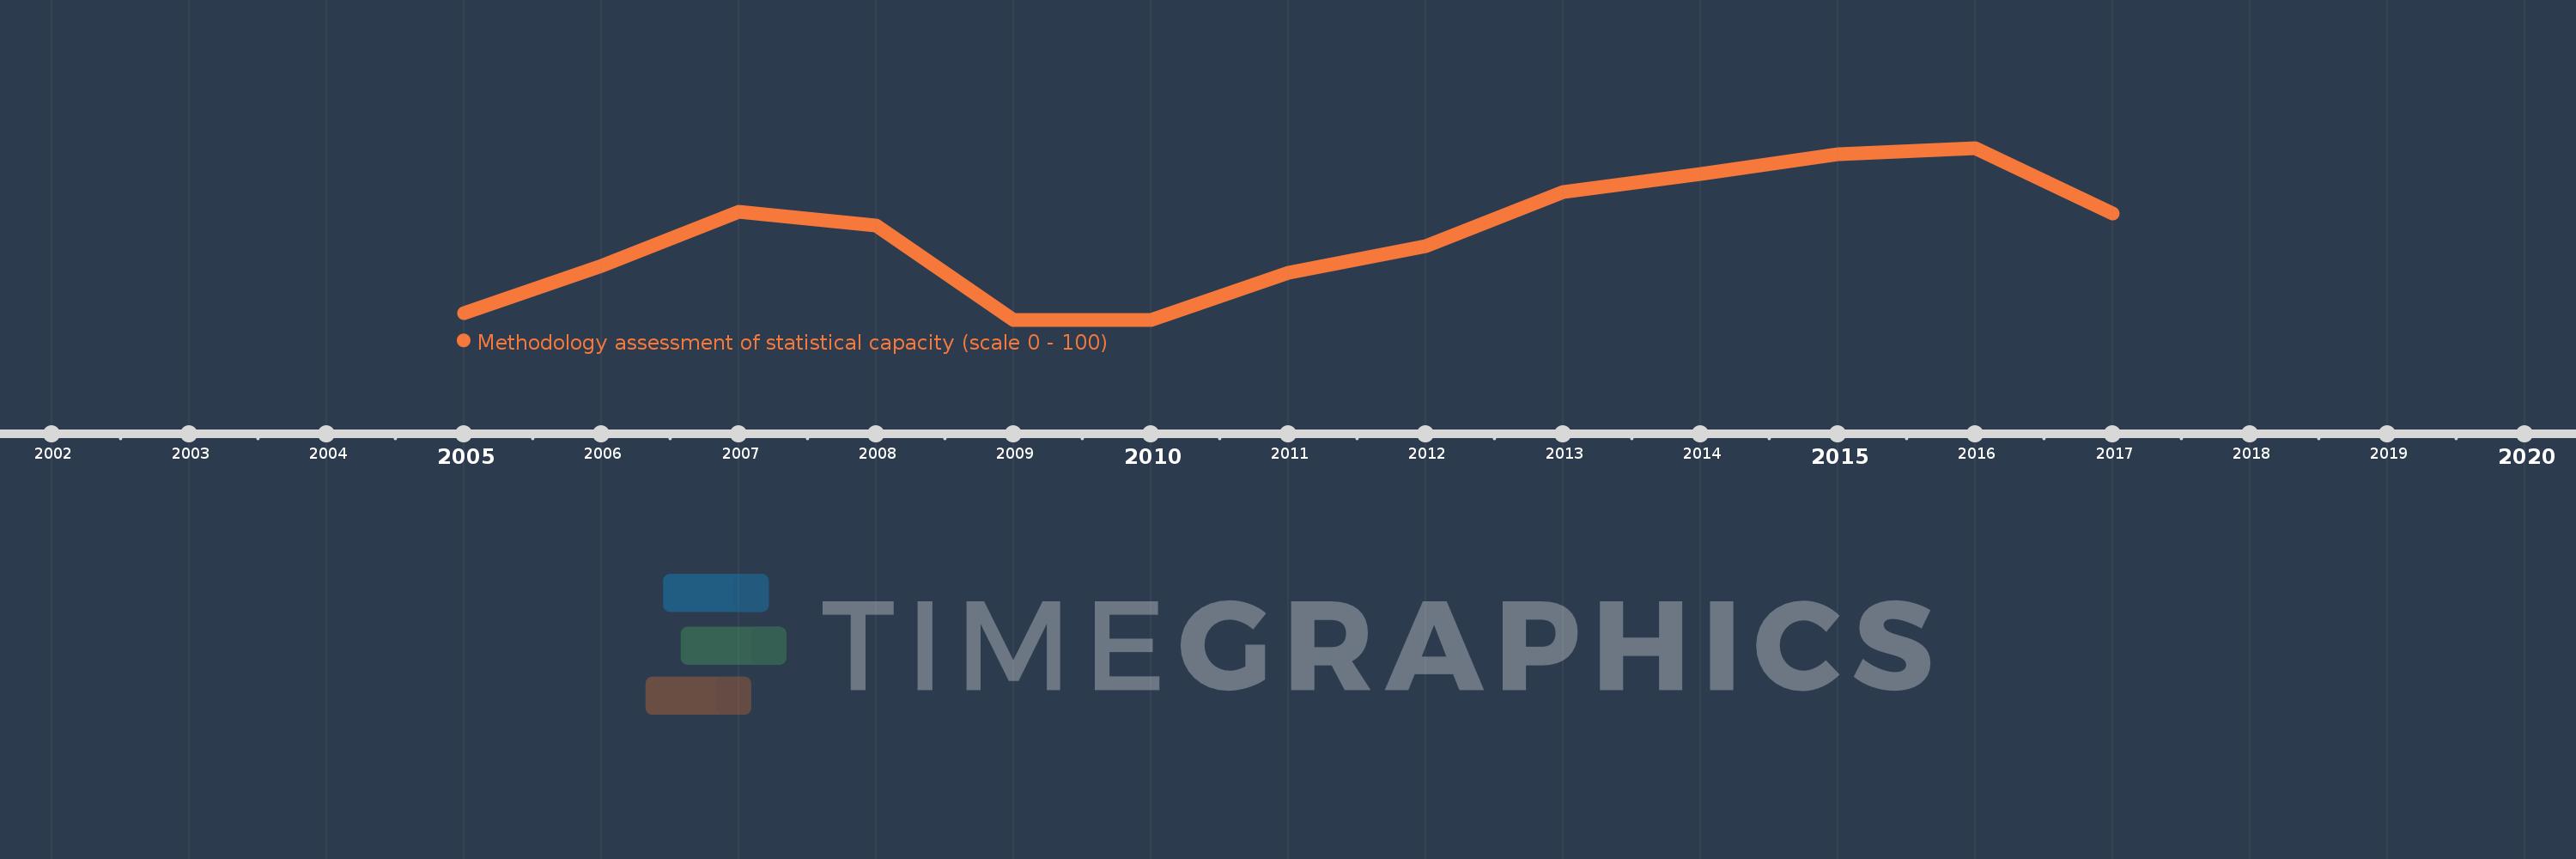
This timeline shows a graph from 2005 to 2017 of Sub-Saharan Africa (IDA & IBRD countries). No data until 2004. Number of actual observations by date: 13.
Source name:
World Development Indicators
Source organization:
World Bank
Categories, topics:
Public Sector
Last updated:
apr 23, 2017
Indicators value changes by year
Meaning:
41.329
Minimum:
38.333
jan 1, 2009
Maximum:
44.419
jan 1, 2016
At the date of observation
Value
Absolute change
Change from the previous value
jan 1, 2005
38.571
+38.571
0.0%
jan 1, 2006
40.238
+1.667
4.32%
jan 1, 2007
42.143
+1.905
4.73%
jan 1, 2008
41.667
-0.476
-1.13%
jan 1, 2009
38.333
-3.333
-8.0%
jan 1, 2010
38.333
0.0
0.0%
jan 1, 2011
40.0
+1.667
4.35%
jan 1, 2012
40.952
+0.952
2.38%
jan 1, 2013
42.857
+1.905
4.65%
jan 1, 2014
43.488
+0.631
1.47%
jan 1, 2015
44.186
+0.698
1.6%
jan 1, 2016
44.419
+0.233
0.53%
jan 1, 2017
42.093
-2.326
-5.24%
Ranking of countries by current statistics by years