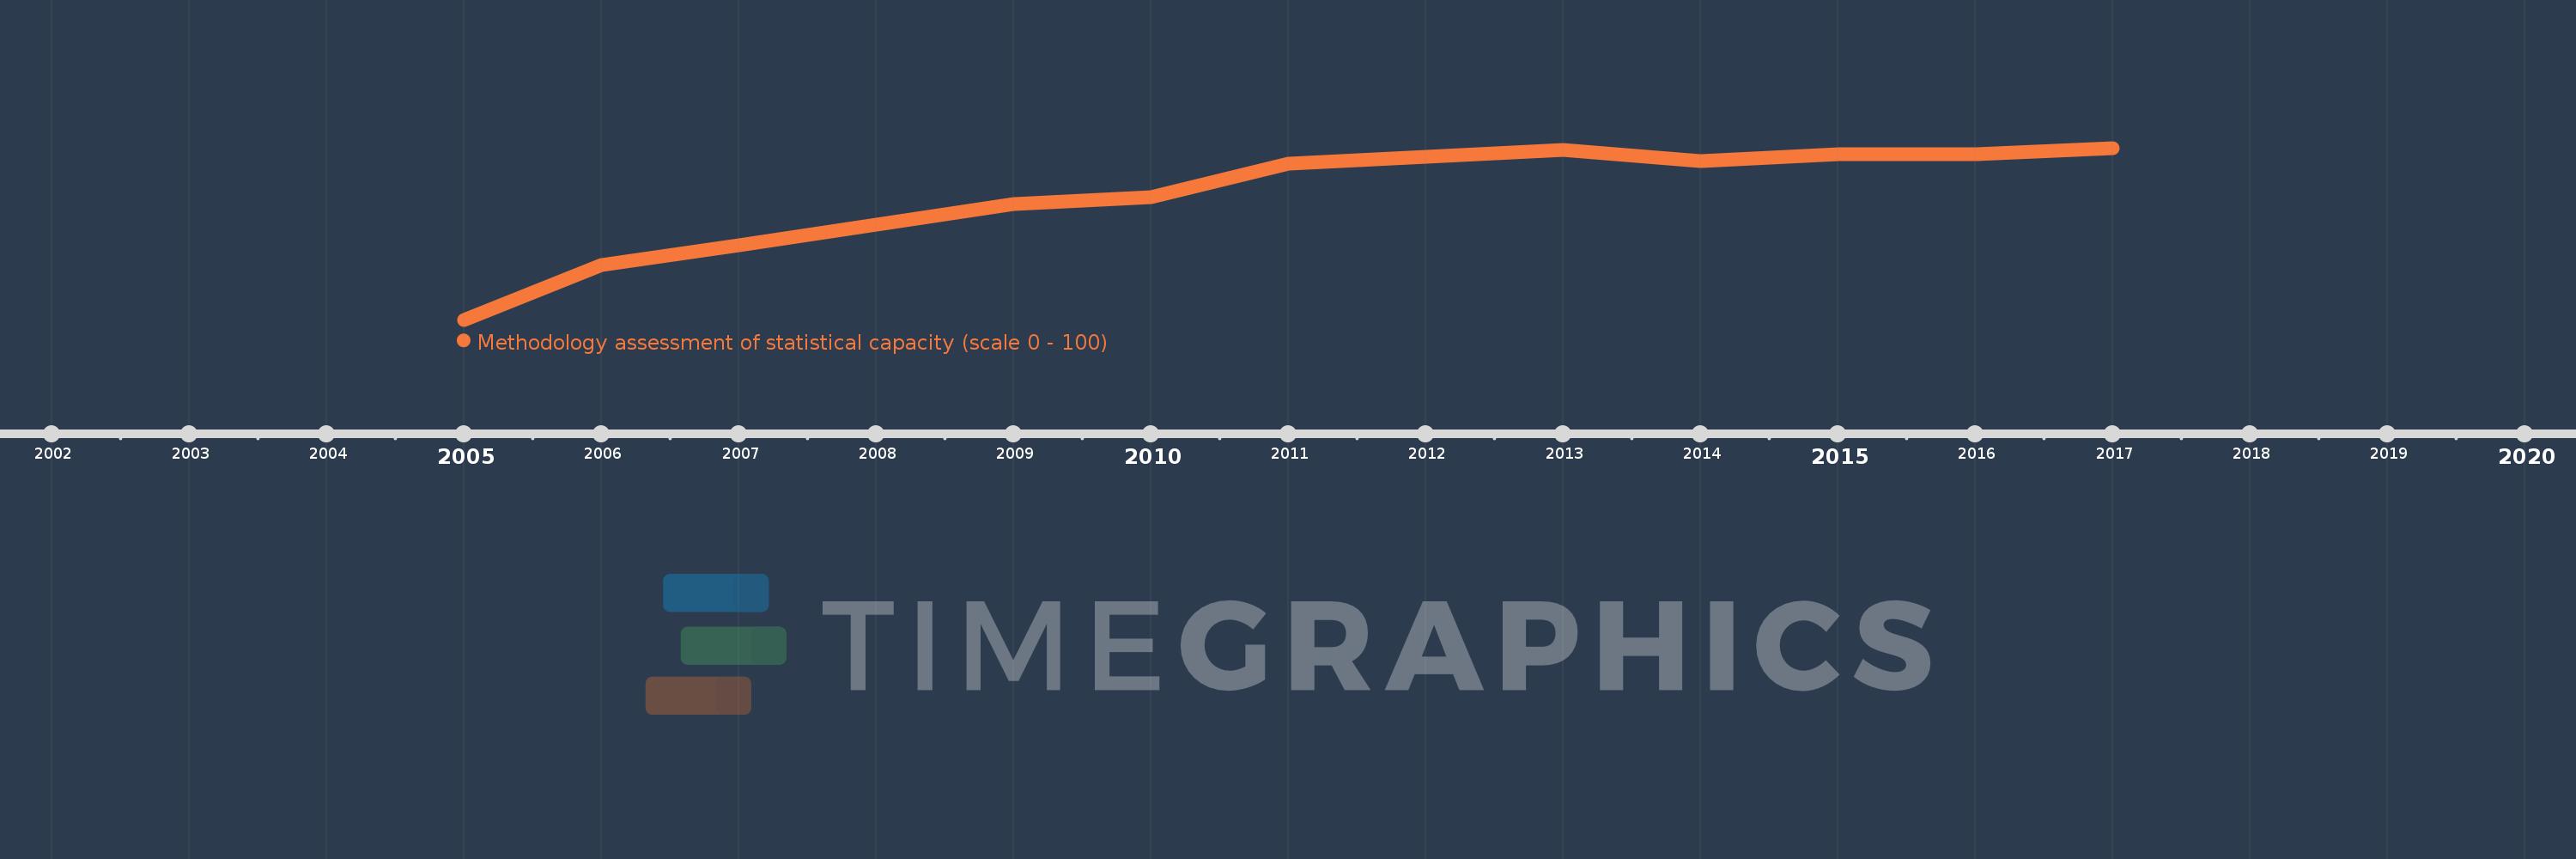
This timeline shows a graph from 2005 to 2017 of Europe & Central Asia (excluding high income). No data until 2004. Number of actual observations by date: 13.
Source name:
World Development Indicators
Source organization:
World Bank
Categories, topics:
Public Sector
Last updated:
apr 23, 2017
Indicators value changes by year
Meaning:
73.814
Minimum:
64.211
jan 1, 2005
Maximum:
77.5
jan 1, 2017
At the date of observation
Value
Absolute change
Change from the previous value
jan 1, 2005
64.211
+64.211
0.0%
jan 1, 2006
68.421
+4.211
6.56%
jan 1, 2007
70.0
+1.579
2.31%
jan 1, 2008
71.579
+1.579
2.26%
jan 1, 2009
73.158
+1.579
2.21%
jan 1, 2010
73.684
+0.526
0.72%
jan 1, 2011
76.316
+2.632
3.57%
jan 1, 2012
76.842
+0.526
0.69%
jan 1, 2013
77.368
+0.526
0.68%
jan 1, 2014
76.5
-0.868
-1.12%
jan 1, 2015
77.0
+0.5
0.65%
jan 1, 2016
77.0
0.0
0.0%
jan 1, 2017
77.5
+0.5
0.65%
Ranking of countries by current statistics by years