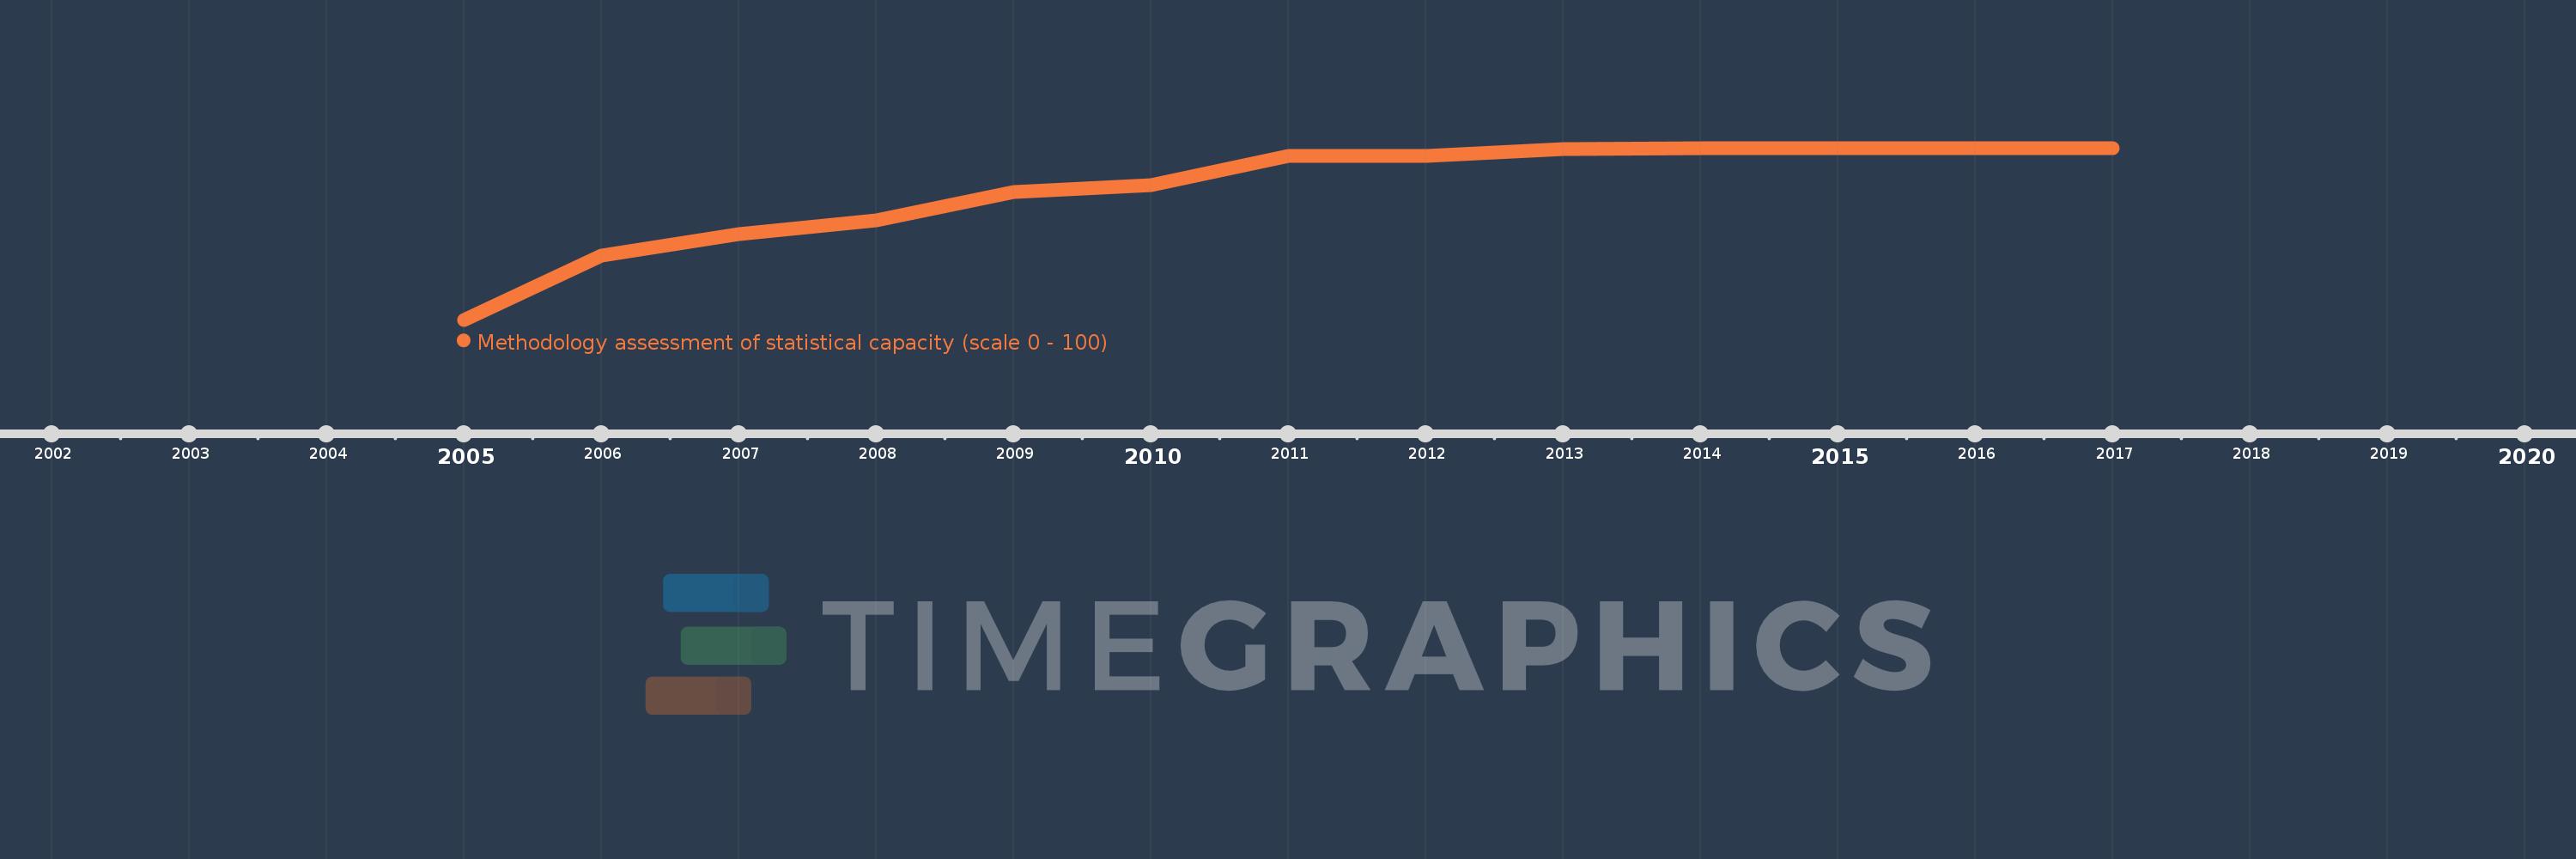
This timeline shows a graph from 2005 to 2017 of Europe & Central Asia (IDA & IBRD countries). No data until 2004. Number of actual observations by date: 13.
Source name:
World Development Indicators
Source organization:
World Bank
Categories, topics:
Public Sector
Last updated:
apr 23, 2017
Indicators value changes by year
Meaning:
75.411
Minimum:
66.667
jan 1, 2005
Maximum:
78.182
jan 1, 2014
At the date of observation
Value
Absolute change
Change from the previous value
jan 1, 2005
66.667
+66.667
0.0%
jan 1, 2006
70.952
+4.286
6.43%
jan 1, 2007
72.381
+1.429
2.01%
jan 1, 2008
73.333
+0.952
1.32%
jan 1, 2009
75.238
+1.905
2.6%
jan 1, 2010
75.714
+0.476
0.63%
jan 1, 2011
77.619
+1.905
2.52%
jan 1, 2012
77.619
0.0
0.0%
jan 1, 2013
78.095
+0.476
0.61%
jan 1, 2014
78.182
+0.087
0.11%
jan 1, 2015
78.182
0.0
0.0%
jan 1, 2016
78.182
0.0
0.0%
jan 1, 2017
78.182
0.0
0.0%
Ranking of countries by current statistics by years