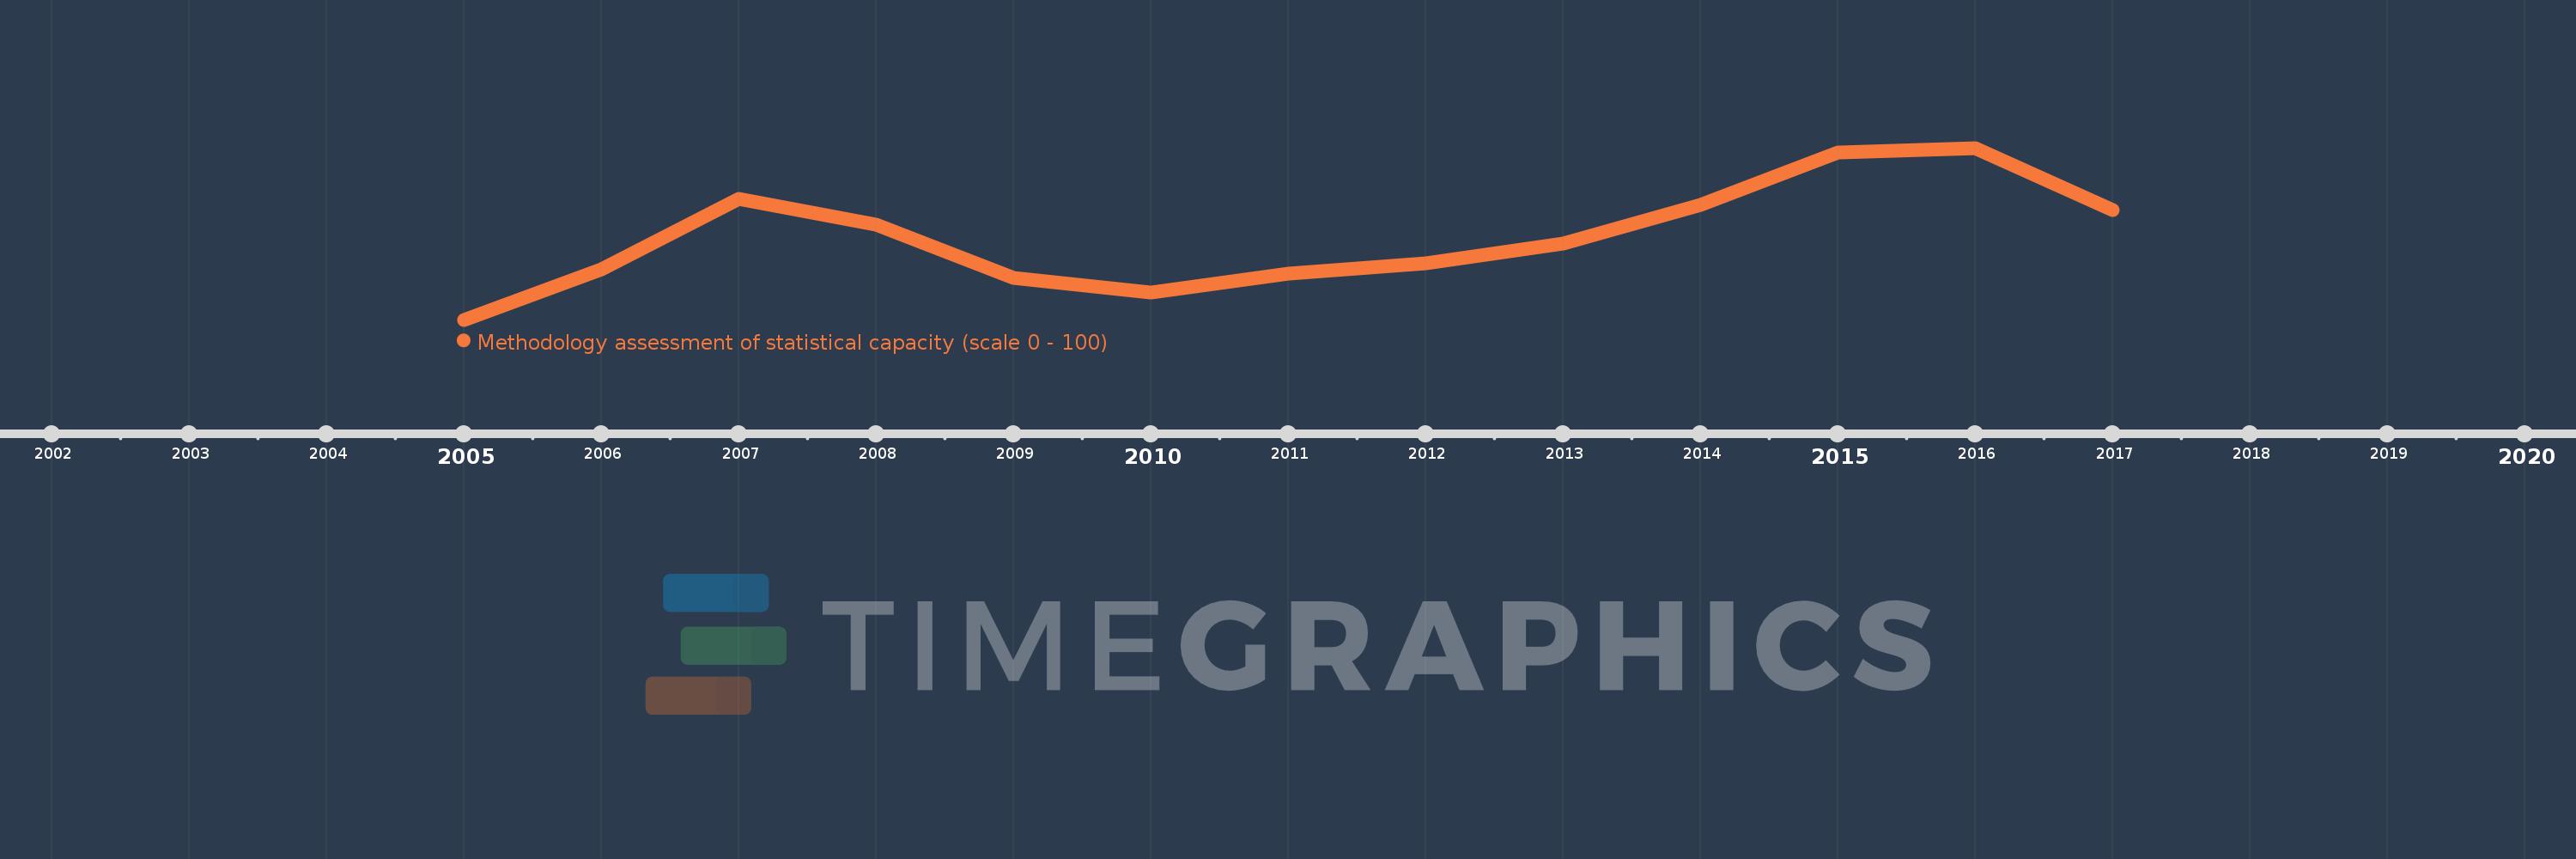
This timeline shows a graph from 2005 to 2017 of Least developed countries: UN classification. No data until 2004. Number of actual observations by date: 13.
Source name:
World Development Indicators
Source organization:
World Bank
Categories, topics:
Public Sector
Last updated:
apr 23, 2017
Indicators value changes by year
Meaning:
39.583
Minimum:
35.135
jan 1, 2005
Maximum:
44.359
jan 1, 2016
At the date of observation
Value
Absolute change
Change from the previous value
jan 1, 2005
35.135
+35.135
0.0%
jan 1, 2006
37.838
+2.703
7.69%
jan 1, 2007
41.622
+3.784
10.0%
jan 1, 2008
40.263
-1.358
-3.26%
jan 1, 2009
37.368
-2.895
-7.19%
jan 1, 2010
36.579
-0.789
-2.11%
jan 1, 2011
37.632
+1.053
2.88%
jan 1, 2012
38.158
+0.526
1.4%
jan 1, 2013
39.211
+1.053
2.76%
jan 1, 2014
41.282
+2.072
5.28%
jan 1, 2015
44.103
+2.821
6.83%
jan 1, 2016
44.359
+0.256
0.58%
jan 1, 2017
41.026
-3.333
-7.51%
Ranking of countries by current statistics by years