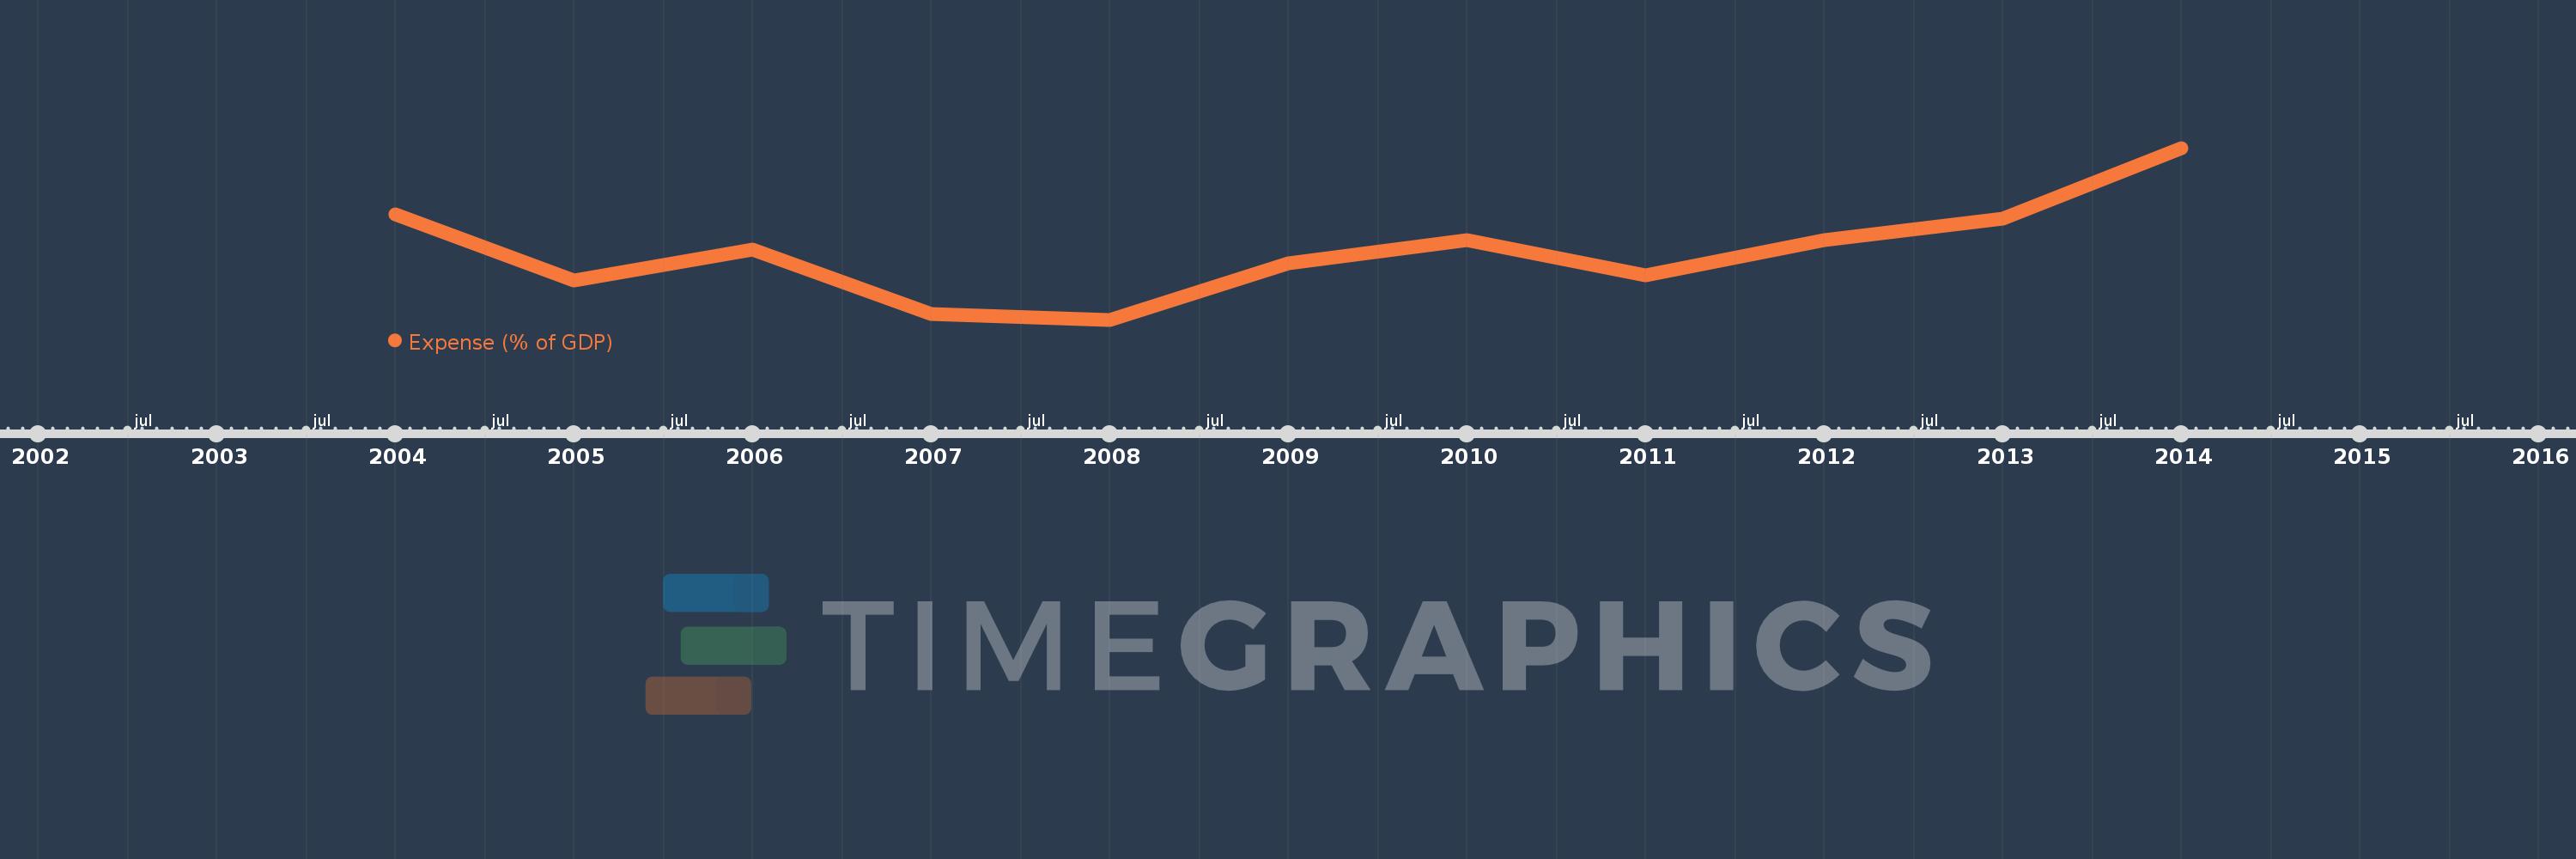
This timeline shows a graph from 2004 to 2014 of Sub-Saharan Africa (IDA & IBRD countries). No data until 2003. Number of actual observations by date: 11.
Source name:
World Development Indicators
Source organization:
International Monetary Fund, Government Finance Statistics Yearbook and data files, and World Bank and OECD GDP estimates.
Categories, topics:
Economy & Growth, Public Sector
Last updated:
apr 23, 2017
Indicators value changes by year
Meaning:
20.272
Minimum:
19.061
jan 1, 2008
Maximum:
22.103
jan 1, 2014
At the date of observation
Value
Absolute change
Change from the previous value
jan 1, 2004
20.92
+20.92
0.0%
jan 1, 2005
19.76
-1.16
-5.54%
jan 1, 2006
20.302
+0.542
2.74%
jan 1, 2007
19.156
-1.147
-5.65%
jan 1, 2008
19.061
-0.095
-0.5%
jan 1, 2009
20.063
+1.002
5.26%
jan 1, 2010
20.471
+0.408
2.03%
jan 1, 2011
19.842
-0.628
-3.07%
jan 1, 2012
20.467
+0.624
3.15%
jan 1, 2013
20.844
+0.377
1.84%
jan 1, 2014
22.103
+1.259
6.04%
Ranking of countries by current statistics by years