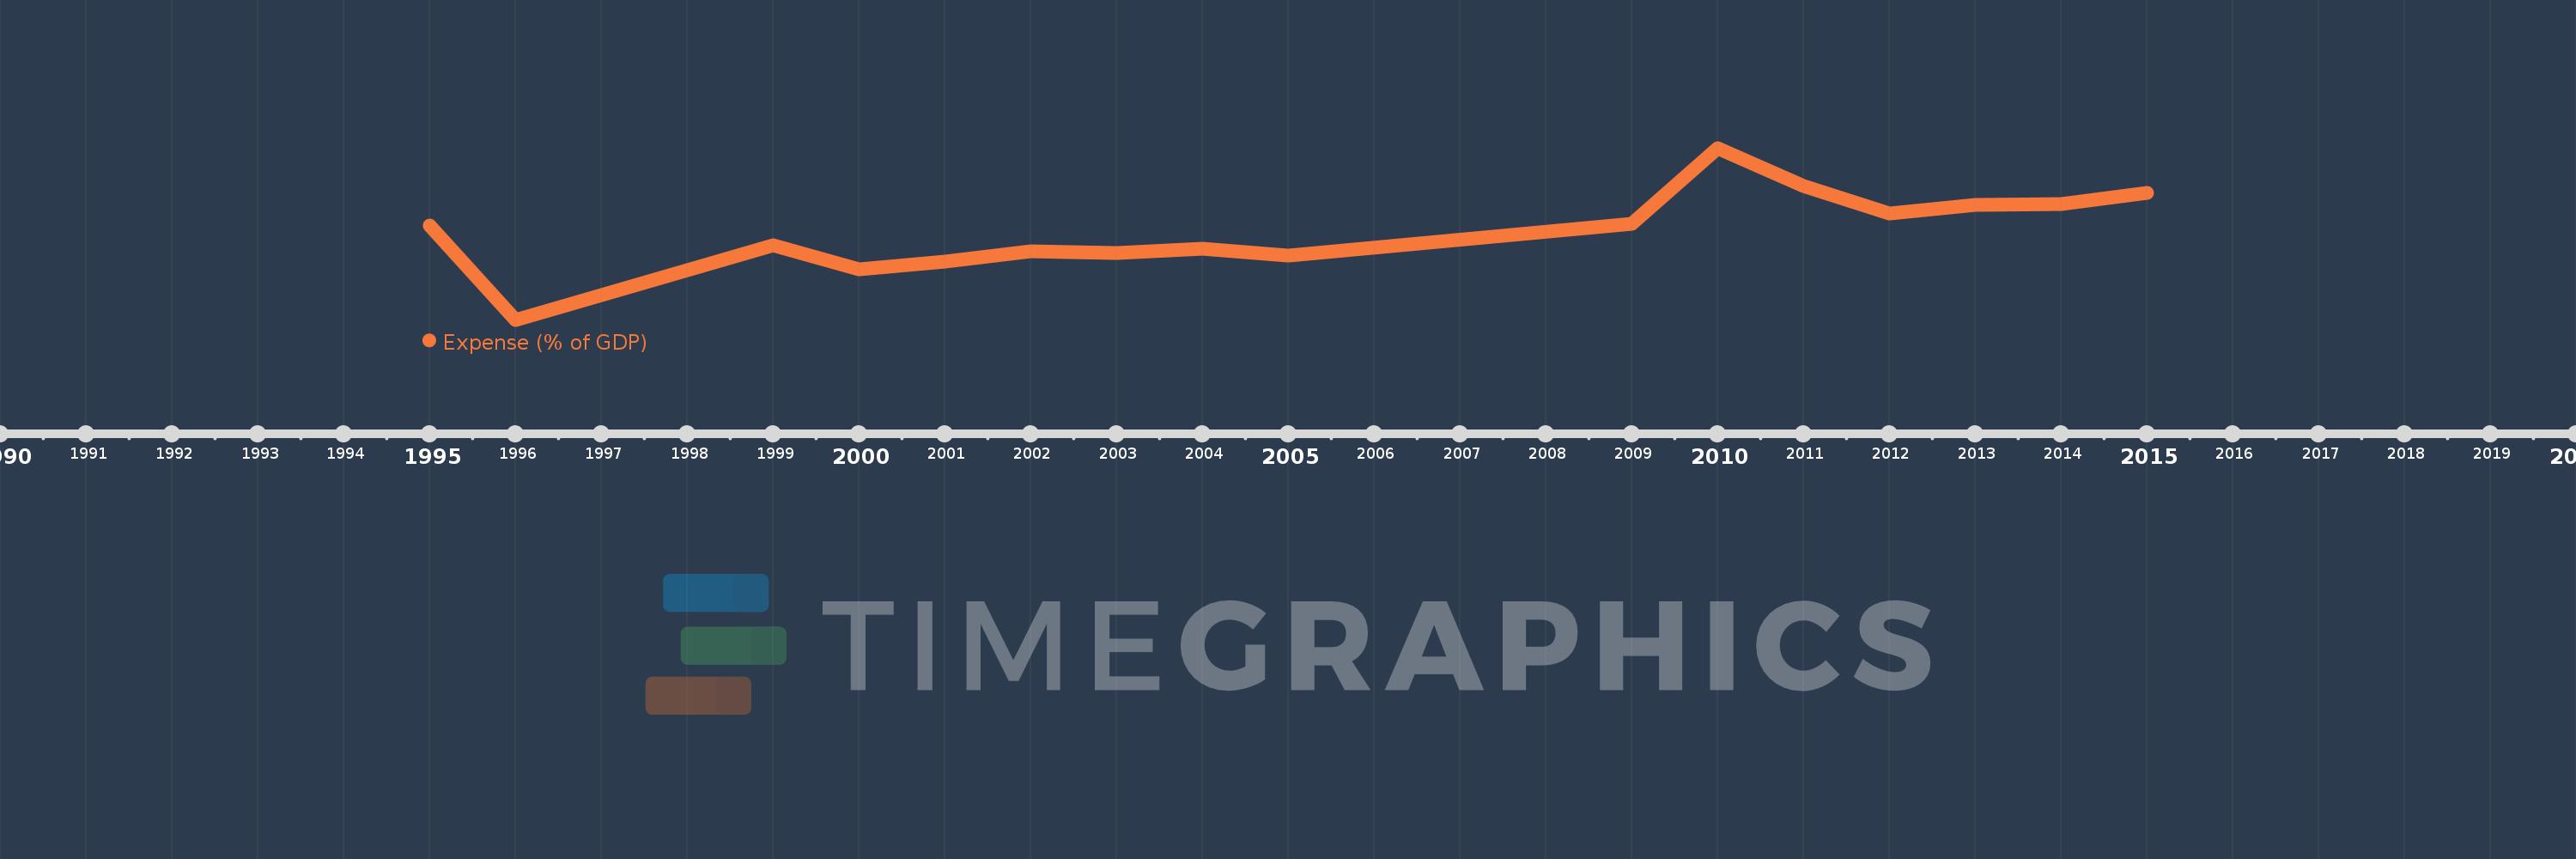
This timeline shows a graph from 1995 to 2015 of Europe & Central Asia (excluding high income). No data until 1994. Number of actual observations by date: 16.
Source name:
World Development Indicators
Source organization:
International Monetary Fund, Government Finance Statistics Yearbook and data files, and World Bank and OECD GDP estimates.
Categories, topics:
Economy & Growth, Public Sector
Last updated:
apr 23, 2017
Indicators value changes by year
Meaning:
25.656
Minimum:
16.643
jan 1, 1996
Maximum:
34.177
jan 1, 2010
At the date of observation
Value
Absolute change
Change from the previous value
jan 1, 1995
26.301
+26.301
0.0%
jan 1, 1996
16.643
-9.658
-36.72%
jan 1, 1999
24.265
+7.622
45.8%
jan 1, 2000
21.79
-2.474
-10.2%
jan 1, 2001
22.546
+0.756
3.47%
jan 1, 2002
23.605
+1.059
4.7%
jan 1, 2003
23.432
-0.173
-0.73%
jan 1, 2004
23.875
+0.444
1.89%
jan 1, 2005
23.167
-0.709
-2.97%
jan 1, 2009
26.453
+3.286
14.19%
jan 1, 2010
34.177
+7.724
29.2%
jan 1, 2011
30.33
-3.847
-11.26%
jan 1, 2012
27.472
-2.858
-9.42%
jan 1, 2013
28.323
+0.851
3.1%
jan 1, 2014
28.49
+0.166
0.59%
jan 1, 2015
29.62
+1.131
3.97%
Ranking of countries by current statistics by years