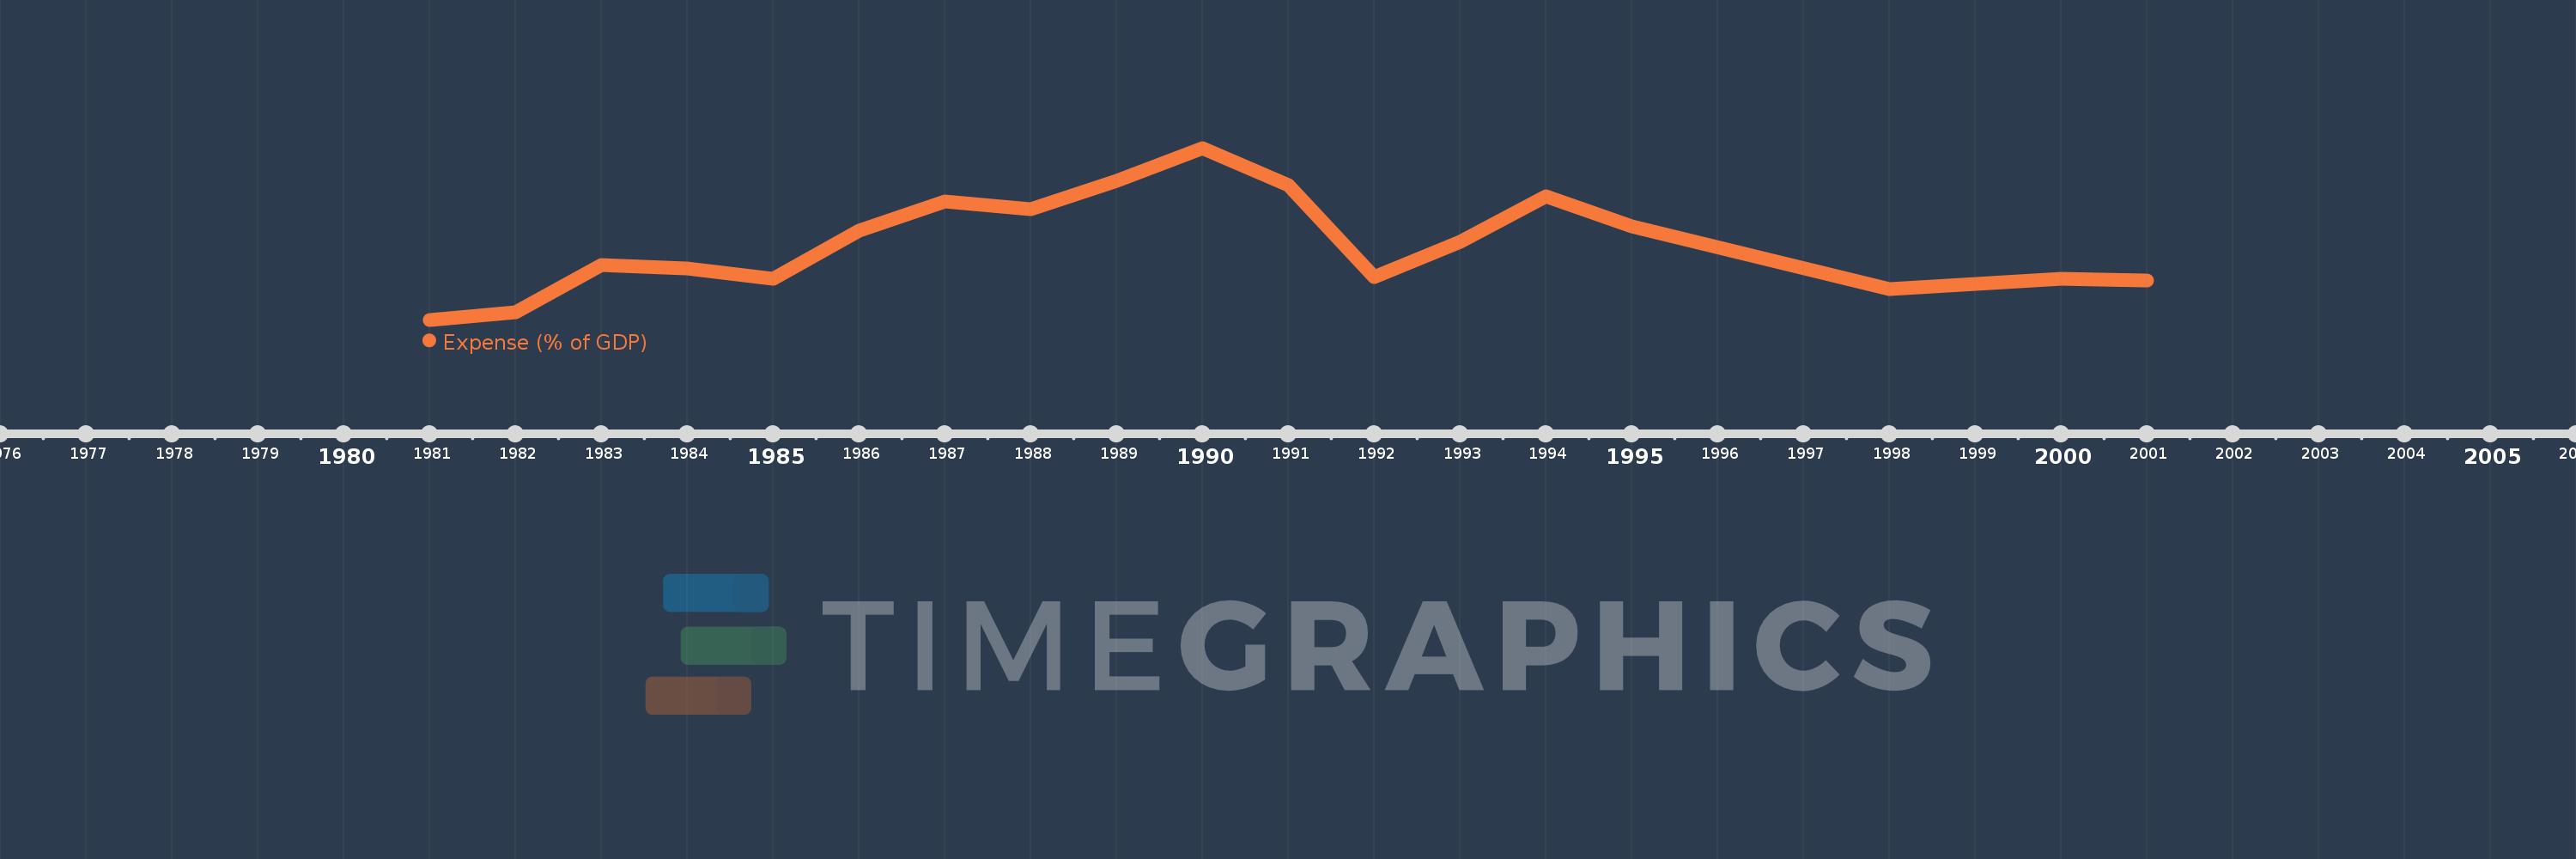
This timeline shows a graph from 1981 to 2001 of Latin America & Caribbean (excluding high income). No data until 1980. Number of actual observations by date: 19.
Source name:
World Development Indicators
Source organization:
International Monetary Fund, Government Finance Statistics Yearbook and data files, and World Bank and OECD GDP estimates.
Categories, topics:
Economy & Growth, Public Sector
Last updated:
apr 23, 2017
Indicators value changes by year
Meaning:
21.816
Minimum:
16.228
jan 1, 1981
Maximum:
29.218
jan 1, 1990
At the date of observation
Value
Absolute change
Change from the previous value
jan 1, 1981
16.228
+16.228
0.0%
jan 1, 1982
16.813
+0.584
3.6%
jan 1, 1983
20.393
+3.581
21.3%
jan 1, 1984
20.126
-0.267
-1.31%
jan 1, 1985
19.352
-0.774
-3.84%
jan 1, 1986
22.989
+3.636
18.79%
jan 1, 1987
25.203
+2.214
9.63%
jan 1, 1988
24.586
-0.617
-2.45%
jan 1, 1989
26.76
+2.174
8.84%
jan 1, 1990
29.218
+2.458
9.19%
jan 1, 1991
26.391
-2.827
-9.68%
jan 1, 1992
19.441
-6.95
-26.33%
jan 1, 1993
22.128
+2.687
13.82%
jan 1, 1994
25.535
+3.406
15.39%
jan 1, 1995
23.313
-2.221
-8.7%
jan 1, 1998
18.575
-4.738
-20.32%
jan 1, 1999
18.947
+0.372
2.0%
jan 1, 2000
19.305
+0.358
1.89%
jan 1, 2001
19.196
-0.109
-0.56%
Ranking of countries by current statistics by years