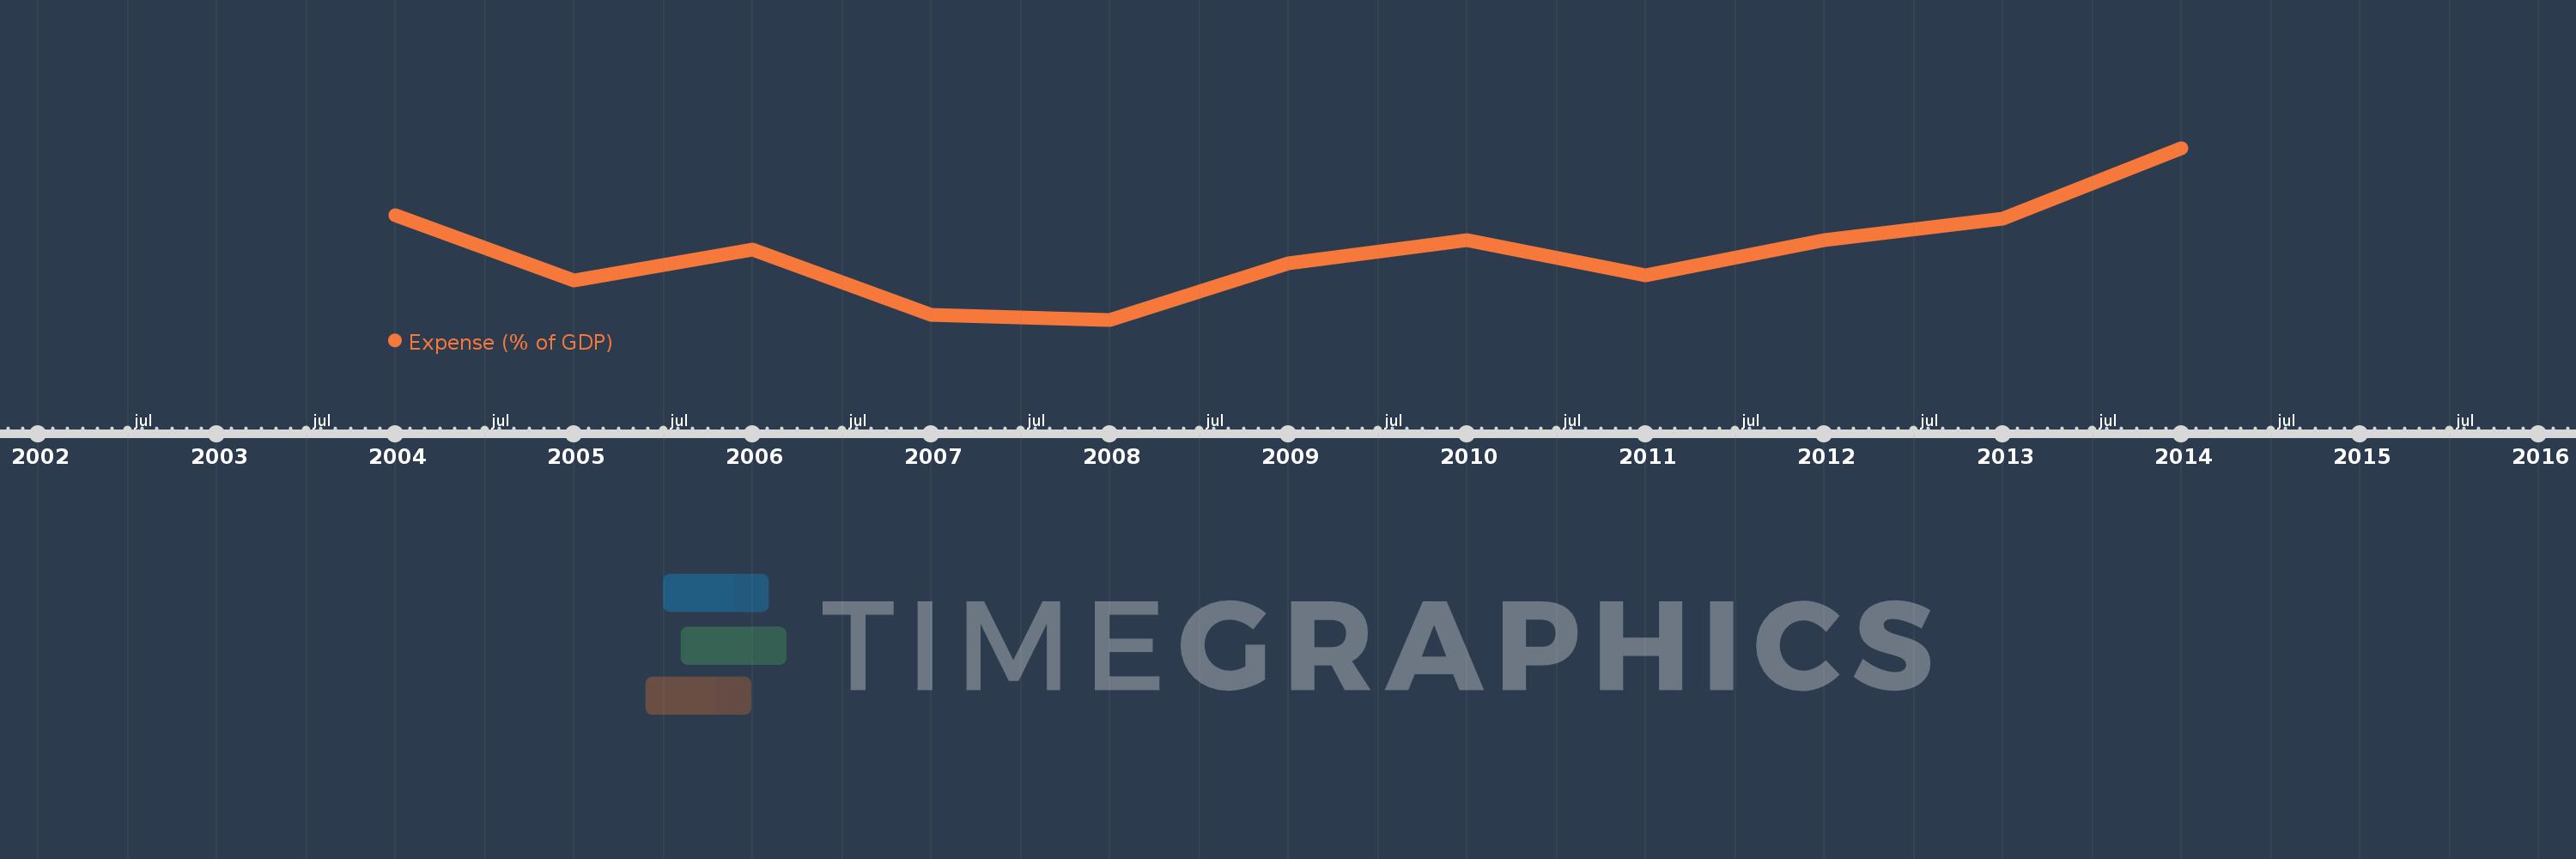
This timeline shows a graph from 2004 to 2014 of Sub-Saharan Africa (excluding high income). No data until 2003. Number of actual observations by date: 11.
Source name:
World Development Indicators
Source organization:
International Monetary Fund, Government Finance Statistics Yearbook and data files, and World Bank and OECD GDP estimates.
Categories, topics:
Economy & Growth, Public Sector
Last updated:
apr 23, 2017
Indicators value changes by year
Meaning:
20.26
Minimum:
19.043
jan 1, 2008
Maximum:
22.099
jan 1, 2014
At the date of observation
Value
Absolute change
Change from the previous value
jan 1, 2004
20.904
+20.904
0.0%
jan 1, 2005
19.742
-1.162
-5.56%
jan 1, 2006
20.286
+0.544
2.76%
jan 1, 2007
19.135
-1.151
-5.67%
jan 1, 2008
19.043
-0.092
-0.48%
jan 1, 2009
20.054
+1.011
5.31%
jan 1, 2010
20.462
+0.408
2.03%
jan 1, 2011
19.832
-0.63
-3.08%
jan 1, 2012
20.461
+0.629
3.17%
jan 1, 2013
20.839
+0.378
1.85%
jan 1, 2014
22.099
+1.26
6.05%
Ranking of countries by current statistics by years