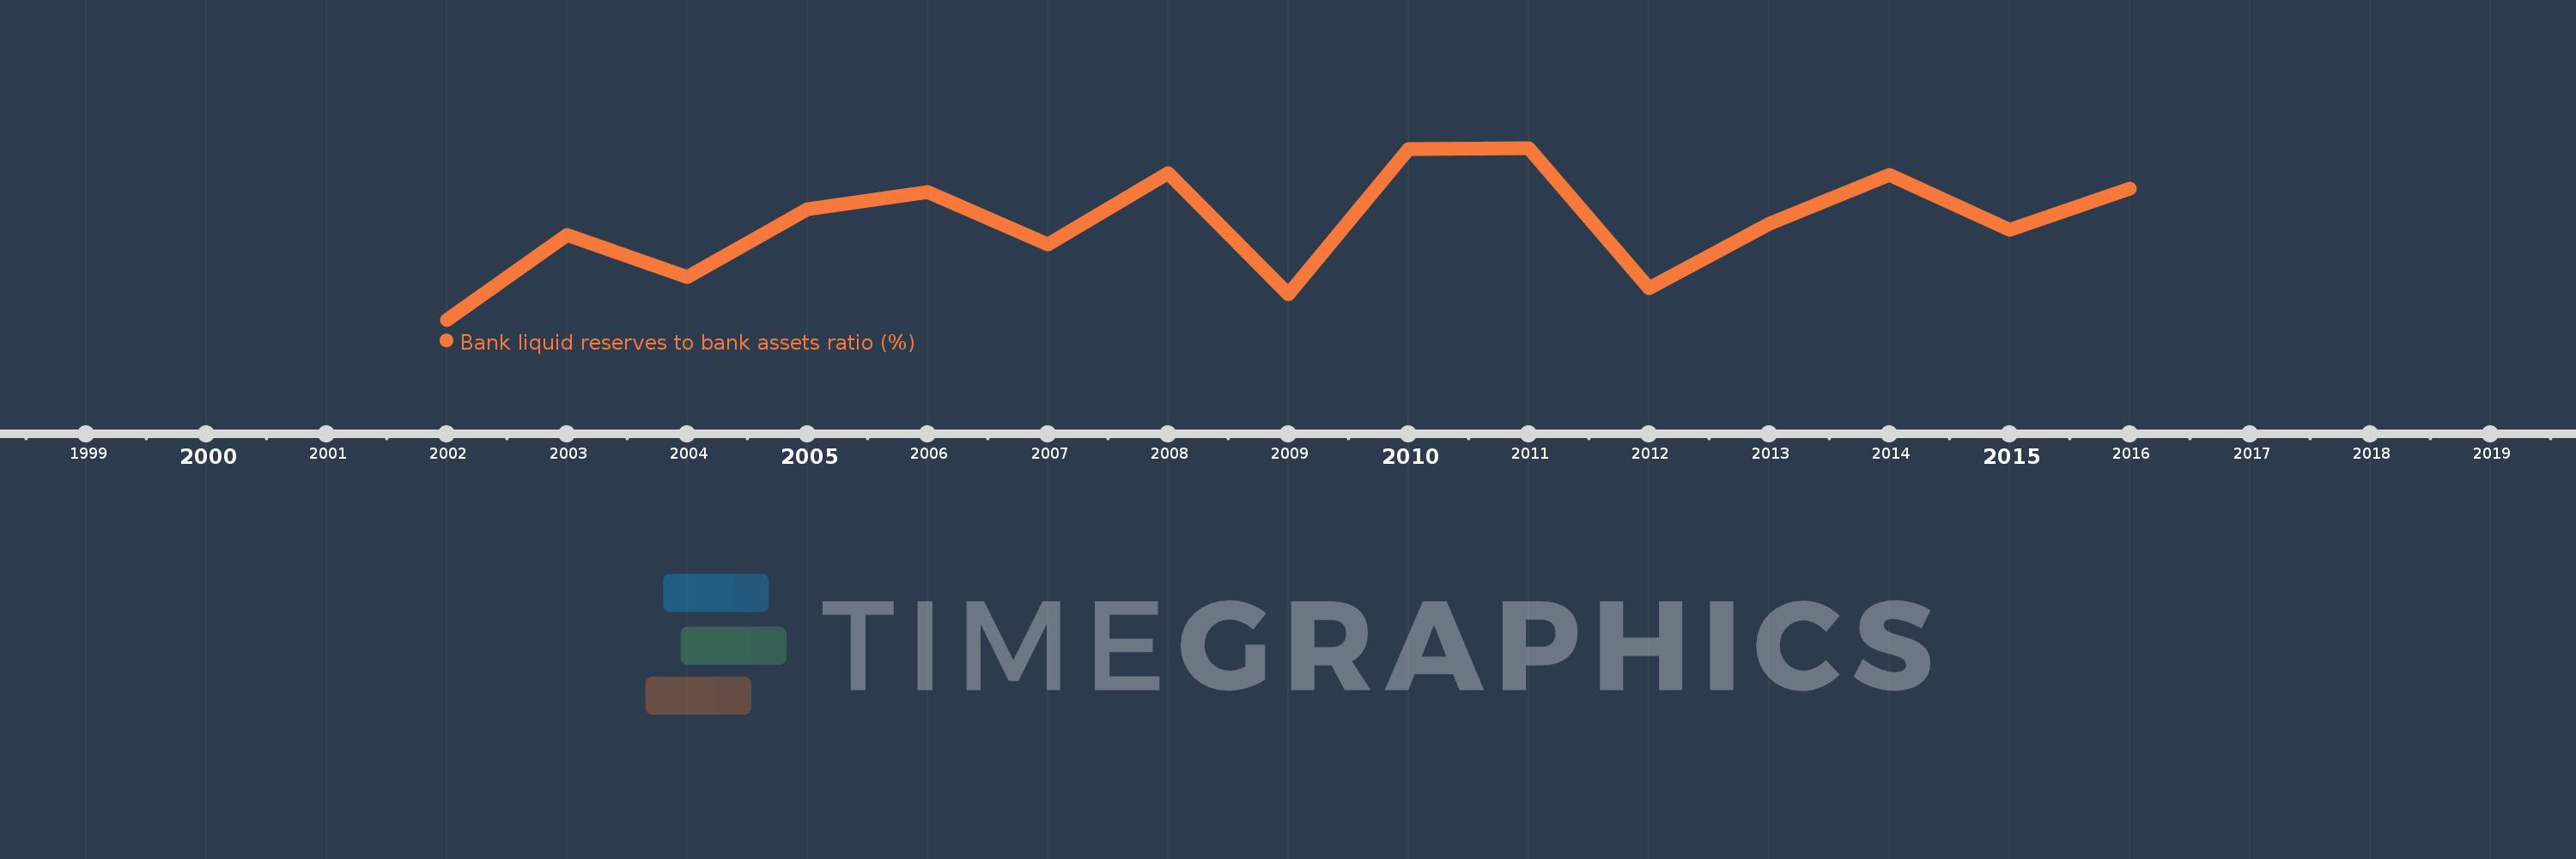
This timeline shows a graph from 2002 to 2016 of Sub-Saharan Africa (IDA & IBRD countries). No data until 2001. Number of actual observations by date: 15.
Source name:
World Development Indicators
Source organization:
International Monetary Fund, International Financial Statistics and data files.
Categories, topics:
Financial Sector
Last updated:
apr 23, 2017
Indicators value changes by year
Meaning:
17.962
Minimum:
16.429
jan 1, 2002
Maximum:
19.155
jan 1, 2011
At the date of observation
Value
Absolute change
Change from the previous value
jan 1, 2002
16.429
+16.429
0.0%
jan 1, 2003
17.775
+1.346
8.19%
jan 1, 2004
17.105
-0.67
-3.77%
jan 1, 2005
18.179
+1.074
6.28%
jan 1, 2006
18.457
+0.278
1.53%
jan 1, 2007
17.618
-0.839
-4.55%
jan 1, 2008
18.749
+1.132
6.42%
jan 1, 2009
16.836
-1.914
-10.21%
jan 1, 2010
19.141
+2.305
13.69%
jan 1, 2011
19.155
+0.014
0.07%
jan 1, 2012
16.923
-2.232
-11.65%
jan 1, 2013
17.953
+1.029
6.08%
jan 1, 2014
18.733
+0.78
4.34%
jan 1, 2015
17.858
-0.874
-4.67%
jan 1, 2016
18.516
+0.658
3.68%
Ranking of countries by current statistics by years