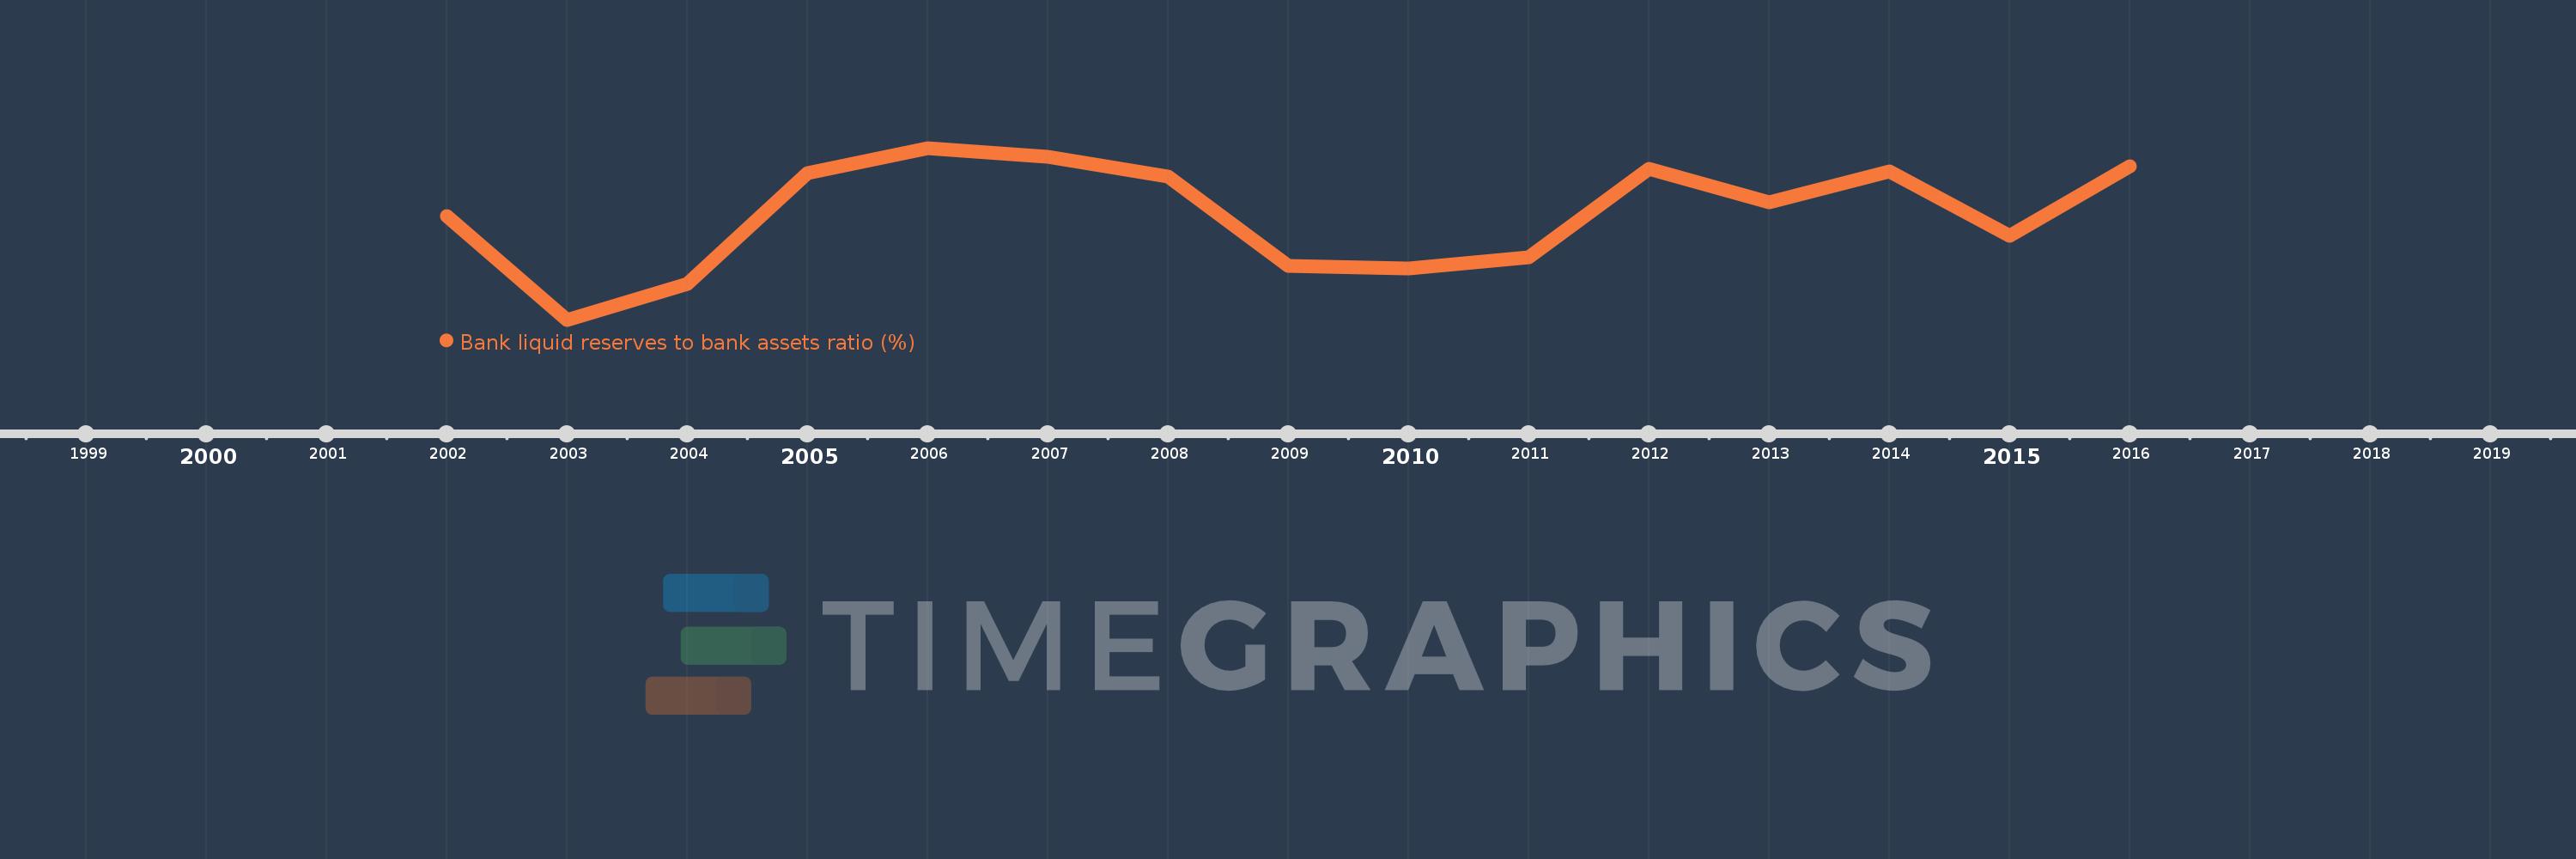
This timeline shows a graph from 2002 to 2016 of Europe & Central Asia (IDA & IBRD countries). No data until 2001. Number of actual observations by date: 15.
Source name:
World Development Indicators
Source organization:
International Monetary Fund, International Financial Statistics and data files.
Categories, topics:
Financial Sector
Last updated:
apr 23, 2017
Indicators value changes by year
Meaning:
16.445
Minimum:
12.583
jan 1, 2003
Maximum:
18.859
jan 1, 2006
At the date of observation
Value
Absolute change
Change from the previous value
jan 1, 2002
16.36
+16.36
0.0%
jan 1, 2003
12.583
-3.777
-23.09%
jan 1, 2004
13.892
+1.309
10.4%
jan 1, 2005
17.927
+4.035
29.05%
jan 1, 2006
18.859
+0.932
5.2%
jan 1, 2007
18.531
-0.328
-1.74%
jan 1, 2008
17.804
-0.727
-3.92%
jan 1, 2009
14.554
-3.249
-18.25%
jan 1, 2010
14.457
-0.097
-0.67%
jan 1, 2011
14.875
+0.418
2.89%
jan 1, 2012
18.085
+3.21
21.58%
jan 1, 2013
16.885
-1.2
-6.64%
jan 1, 2014
18.014
+1.129
6.69%
jan 1, 2015
15.65
-2.364
-13.12%
jan 1, 2016
18.202
+2.552
16.31%
Ranking of countries by current statistics by years