Download This statistics in other country:
Timeline:
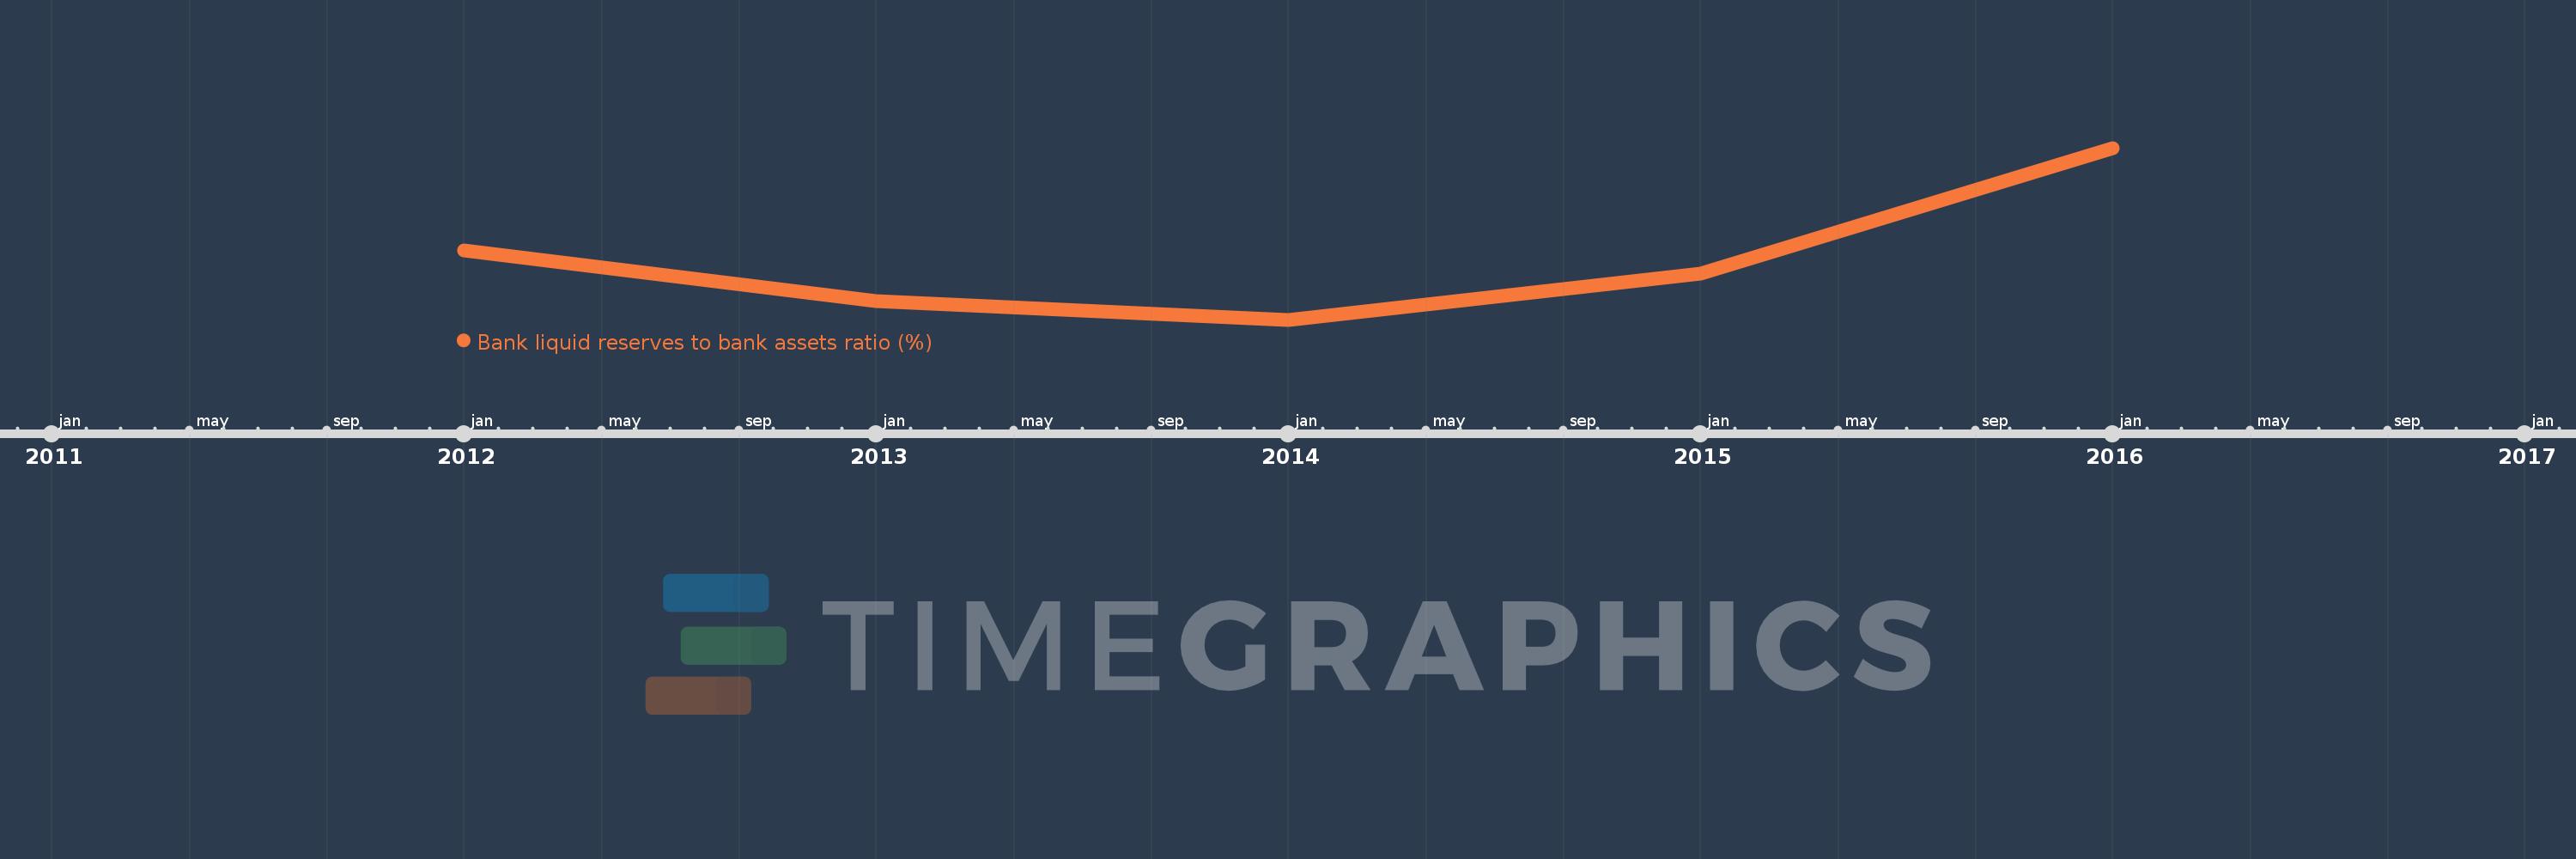
This timeline shows a graph from 2012 to 2016 of South Sudan. No data until 2011. Number of actual observations by date: 5.
Source name:
World Development Indicators
Source organization:
International Monetary Fund, International Financial Statistics and data files.
Categories, topics:
Financial Sector
Last updated:
apr 23, 2017
Indicators value changes by year
Minimum:
154.074
jan 1, 2014
Maximum:
390.11
jan 1, 2016
At the date of observation
Value
Absolute change
Change from the previous value
jan 1, 2012
249.636
+249.636
0.0%
jan 1, 2013
179.198
-70.438
-28.22%
jan 1, 2014
154.074
-25.124
-14.02%
jan 1, 2015
217.714
+63.64
41.3%
jan 1, 2016
390.11
+172.396
79.18%
Ranking of countries by current statistics by years