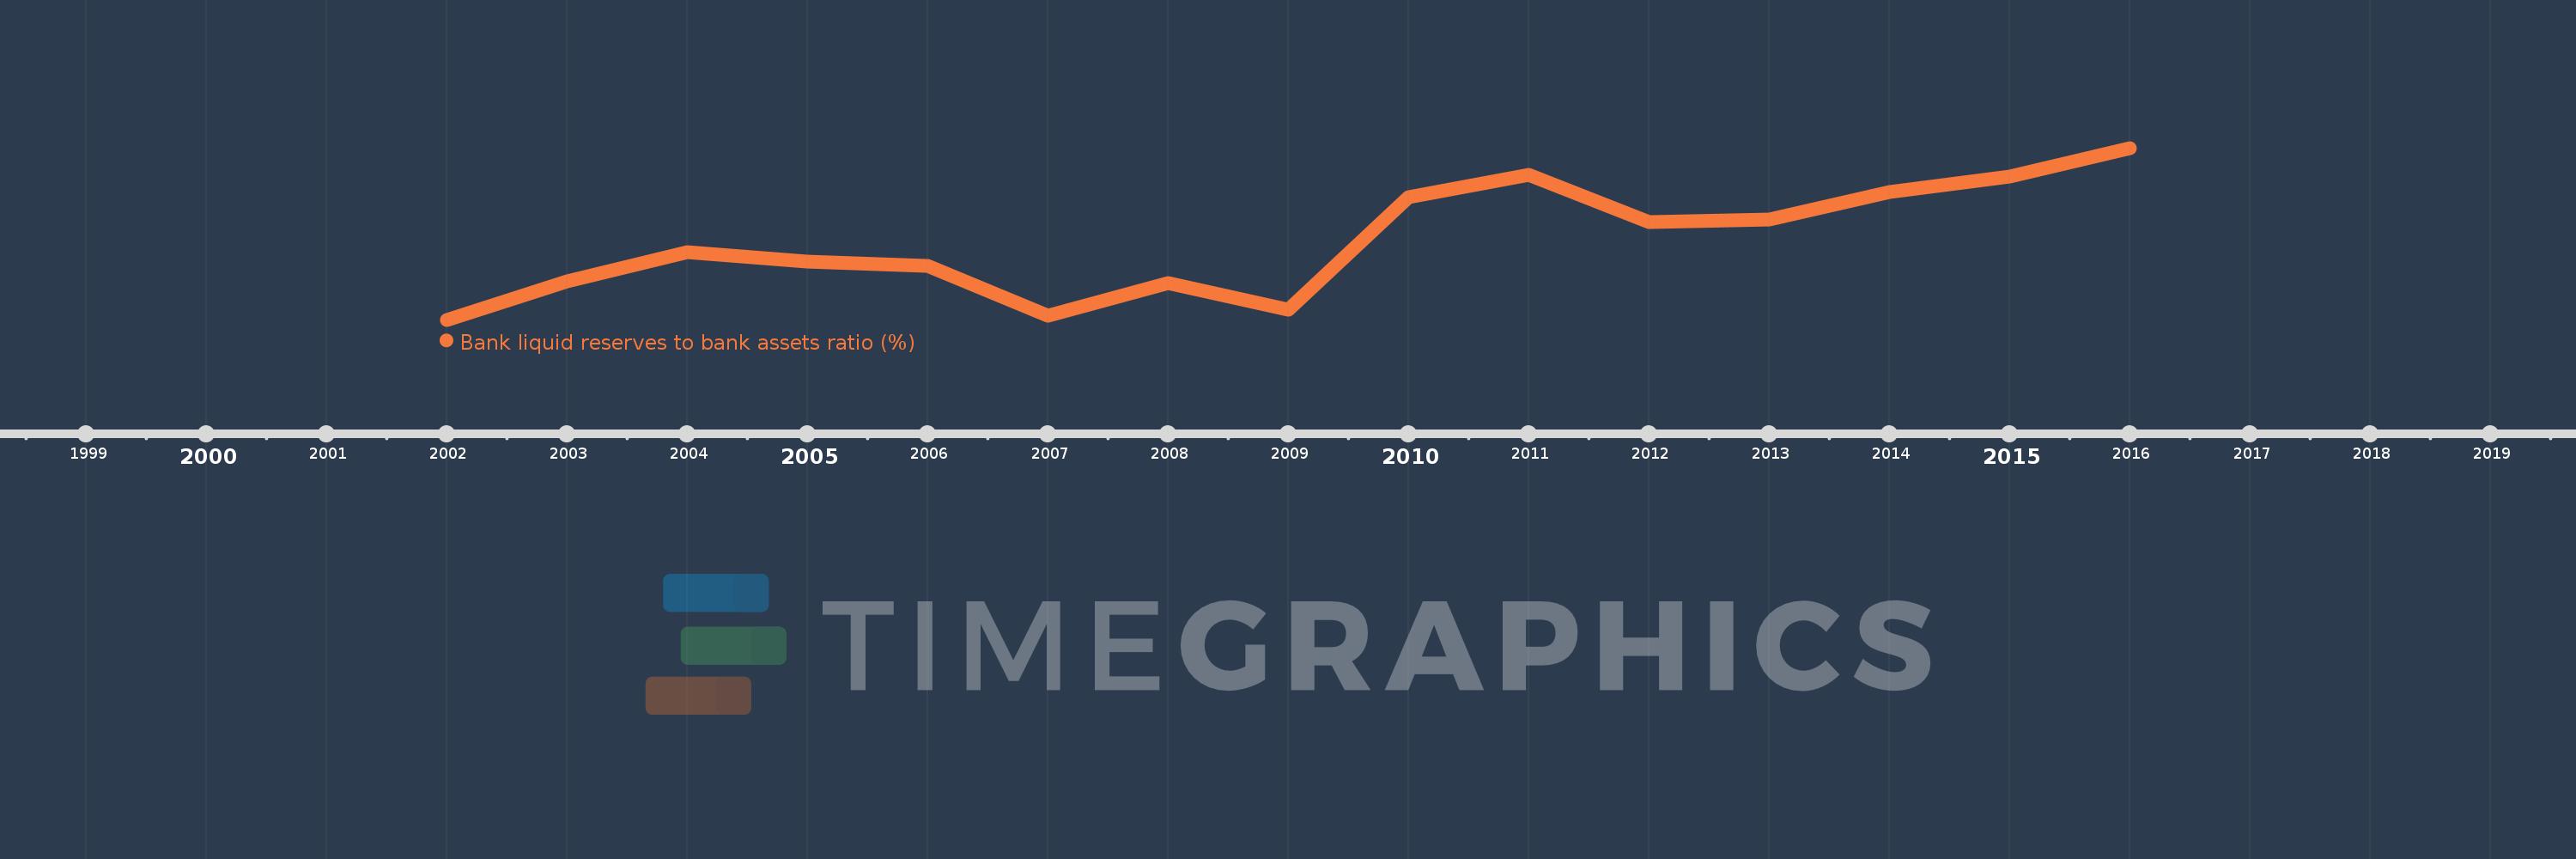
This timeline shows a graph from 2002 to 2016 of Latin America & the Caribbean (IDA & IBRD countries). No data until 2001. Number of actual observations by date: 15.
Source name:
World Development Indicators
Source organization:
International Monetary Fund, International Financial Statistics and data files.
Categories, topics:
Financial Sector
Last updated:
apr 23, 2017
Indicators value changes by year
Meaning:
18.615
Minimum:
15.775
jan 1, 2002
Maximum:
21.996
jan 1, 2016
At the date of observation
Value
Absolute change
Change from the previous value
jan 1, 2002
15.775
+15.775
0.0%
jan 1, 2003
17.151
+1.376
8.72%
jan 1, 2004
18.209
+1.058
6.17%
jan 1, 2005
17.879
-0.33
-1.81%
jan 1, 2006
17.737
-0.142
-0.8%
jan 1, 2007
15.923
-1.813
-10.22%
jan 1, 2008
17.091
+1.168
7.33%
jan 1, 2009
16.15
-0.941
-5.51%
jan 1, 2010
20.201
+4.051
25.09%
jan 1, 2011
21.032
+0.831
4.11%
jan 1, 2012
19.312
-1.72
-8.18%
jan 1, 2013
19.405
+0.093
0.48%
jan 1, 2014
20.41
+1.005
5.18%
jan 1, 2015
20.951
+0.54
2.65%
jan 1, 2016
21.996
+1.045
4.99%
Ranking of countries by current statistics by years