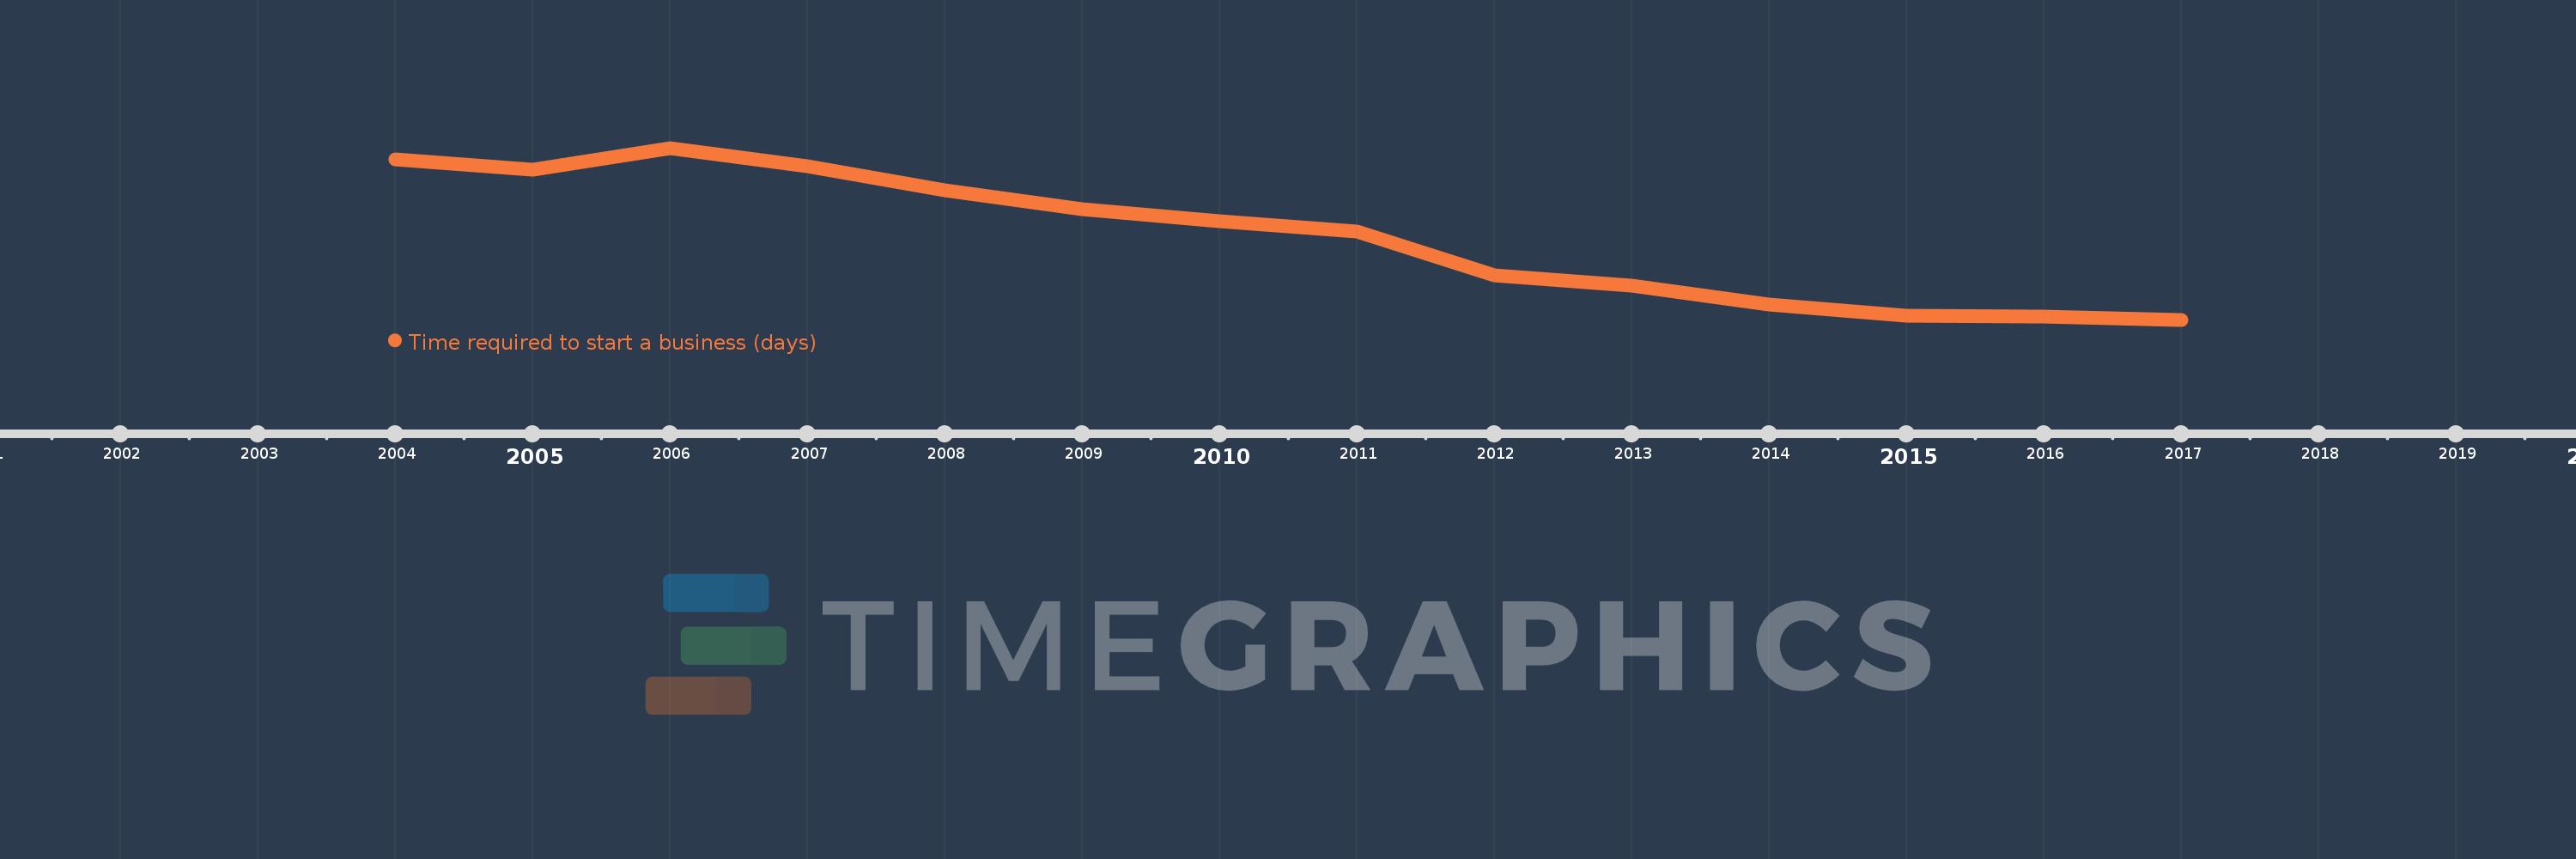
This timeline shows a graph from 2004 to 2017 of Sub-Saharan Africa (excluding high income). No data until 2003. Number of actual observations by date: 14.
Source name:
World Development Indicators
Source organization:
World Bank, Doing Business project (http://www.doingbusiness.org/).
Categories, topics:
Private Sector
Last updated:
apr 23, 2017
Indicators value changes by year
Meaning:
44.964
Minimum:
27.291
jan 1, 2017
Maximum:
63.875
jan 1, 2006
At the date of observation
Value
Absolute change
Change from the previous value
jan 1, 2004
61.364
+61.364
0.0%
jan 1, 2005
59.162
-2.201
-3.59%
jan 1, 2006
63.875
+4.713
7.97%
jan 1, 2007
59.922
-3.953
-6.19%
jan 1, 2008
54.878
-5.044
-8.42%
jan 1, 2009
50.822
-4.056
-7.39%
jan 1, 2010
48.222
-2.6
-5.12%
jan 1, 2011
46.022
-2.2
-4.56%
jan 1, 2012
36.722
-9.3
-20.21%
jan 1, 2013
34.609
-2.114
-5.76%
jan 1, 2014
30.467
-4.141
-11.97%
jan 1, 2015
28.163
-2.304
-7.56%
jan 1, 2016
27.979
-0.184
-0.65%
jan 1, 2017
27.291
-0.687
-2.46%
Ranking of countries by current statistics by years