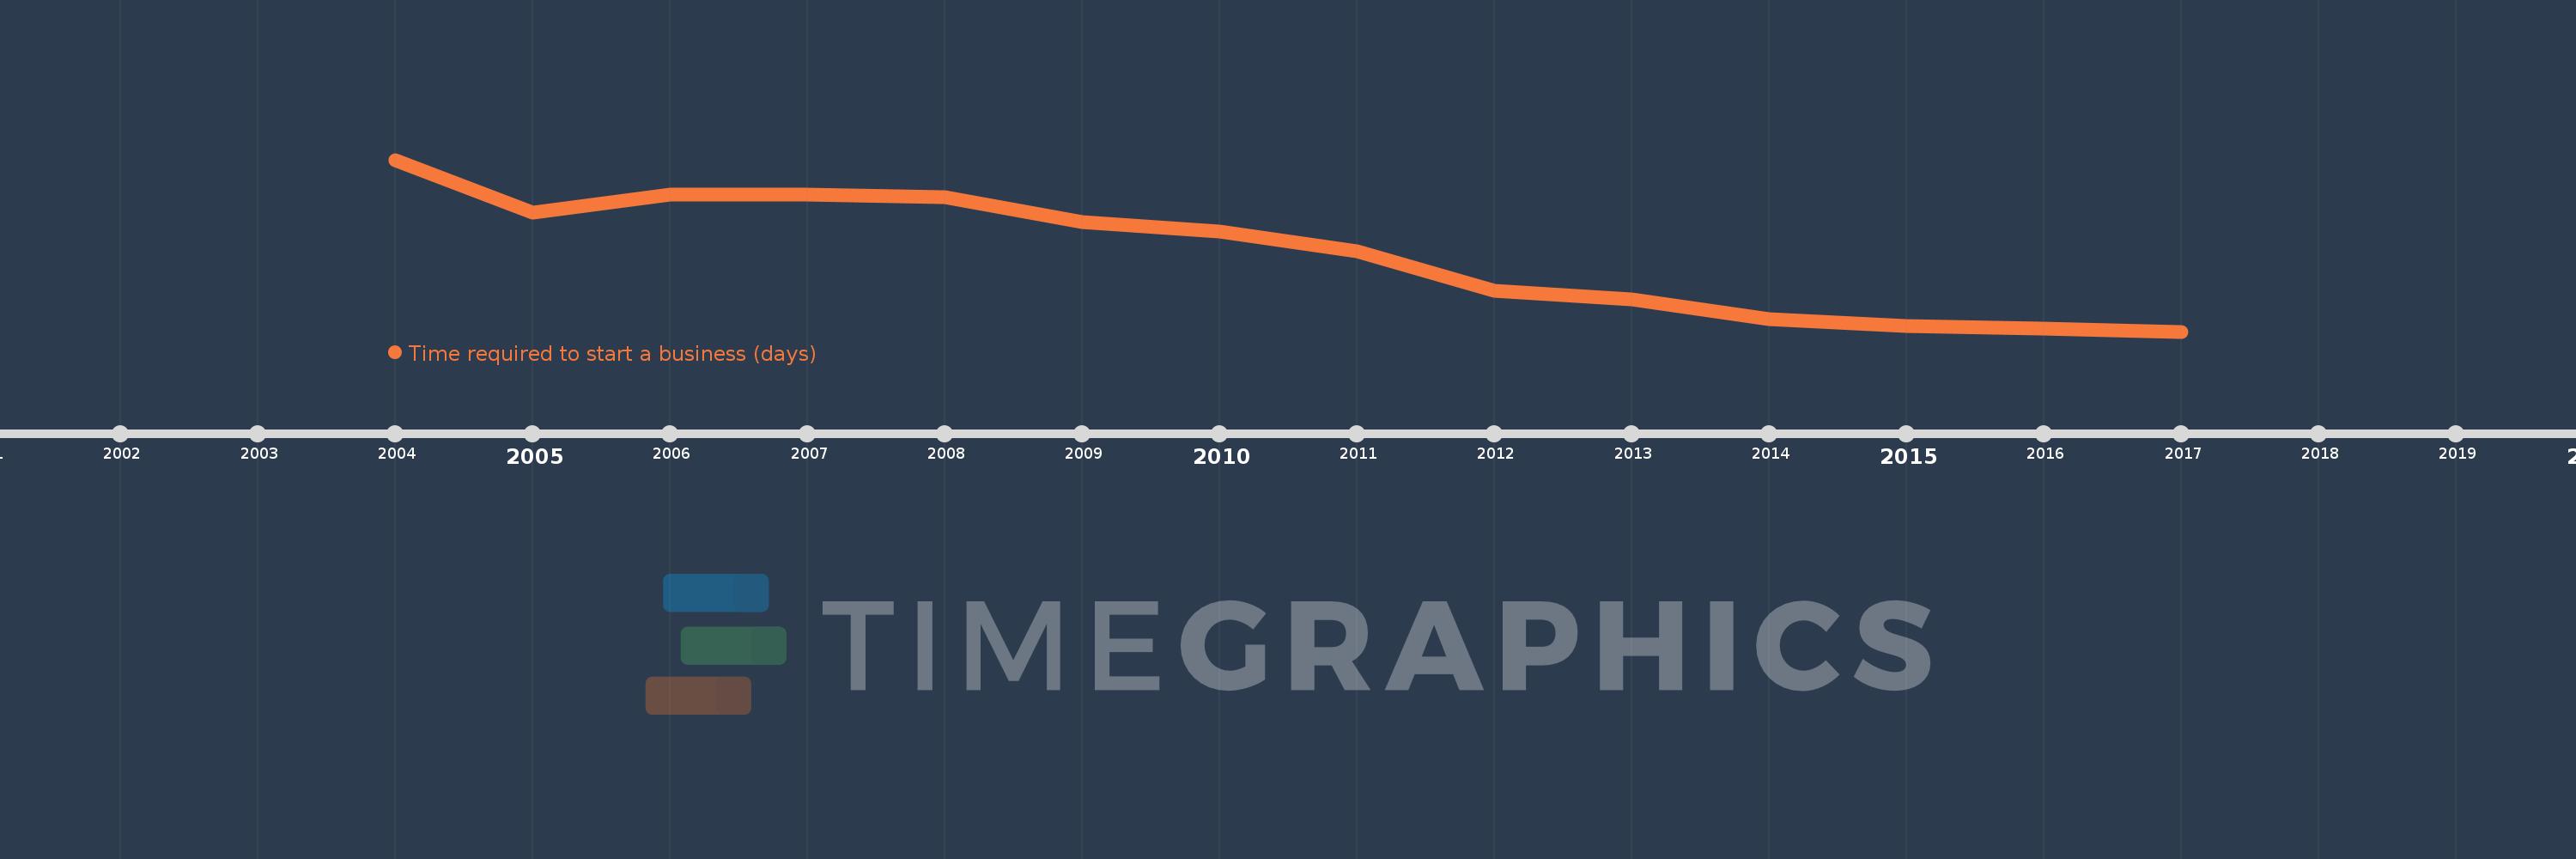
This timeline shows a graph from 2004 to 2017 of Fragile and conflict affected situations. No data until 2003. Number of actual observations by date: 14.
Source name:
World Development Indicators
Source organization:
World Bank, Doing Business project (http://www.doingbusiness.org/).
Categories, topics:
Private Sector
Last updated:
apr 23, 2017
Indicators value changes by year
Meaning:
45.101
Minimum:
27.176
jan 1, 2017
Maximum:
66.974
jan 1, 2004
At the date of observation
Value
Absolute change
Change from the previous value
jan 1, 2004
66.974
+66.974
0.0%
jan 1, 2005
54.729
-12.245
-18.28%
jan 1, 2006
58.964
+4.235
7.74%
jan 1, 2007
58.966
+0.001
0.0%
jan 1, 2008
58.276
-0.69
-1.17%
jan 1, 2009
52.586
-5.69
-9.76%
jan 1, 2010
50.333
-2.253
-4.28%
jan 1, 2011
45.833
-4.5
-8.94%
jan 1, 2012
36.65
-9.183
-20.04%
jan 1, 2013
34.591
-2.059
-5.62%
jan 1, 2014
30.015
-4.576
-13.23%
jan 1, 2015
28.5
-1.515
-5.05%
jan 1, 2016
27.824
-0.676
-2.37%
jan 1, 2017
27.176
-0.647
-2.33%
Ranking of countries by current statistics by years