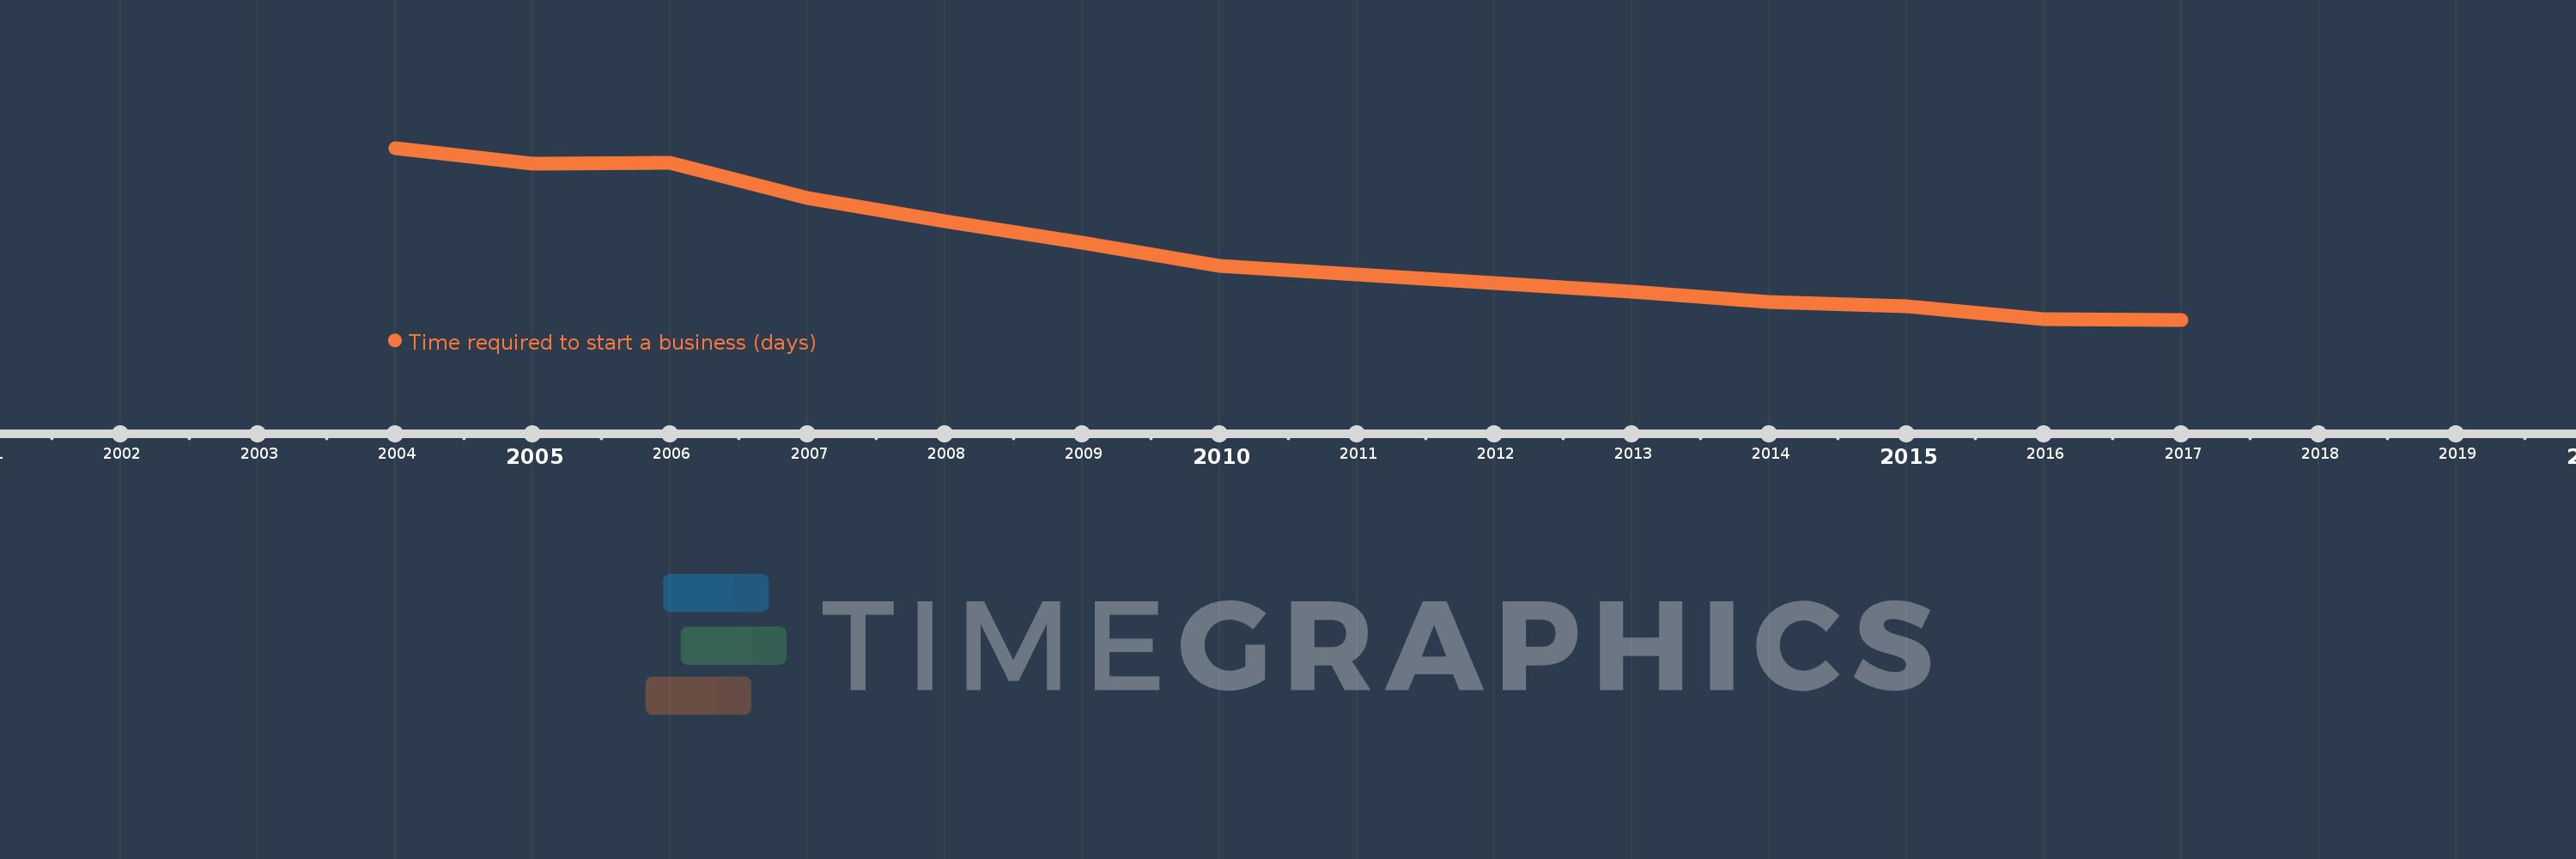
This timeline shows a graph from 2004 to 2017 of Europe & Central Asia (excluding high income). No data until 2003. Number of actual observations by date: 14.
Source name:
World Development Indicators
Source organization:
World Bank, Doing Business project (http://www.doingbusiness.org/).
Categories, topics:
Private Sector
Last updated:
apr 23, 2017
Indicators value changes by year
Meaning:
24.588
Minimum:
10.94
jan 1, 2017
Maximum:
44.471
jan 1, 2004
At the date of observation
Value
Absolute change
Change from the previous value
jan 1, 2004
44.471
+44.471
0.0%
jan 1, 2005
41.412
-3.059
-6.88%
jan 1, 2006
41.556
+0.144
0.35%
jan 1, 2007
34.632
-6.924
-16.66%
jan 1, 2008
30.211
-4.421
-12.77%
jan 1, 2009
26.053
-4.158
-13.76%
jan 1, 2010
21.45
-4.603
-17.67%
jan 1, 2011
19.85
-1.6
-7.46%
jan 1, 2012
18.1
-1.75
-8.82%
jan 1, 2013
16.5
-1.6
-8.84%
jan 1, 2014
14.42
-2.08
-12.61%
jan 1, 2015
13.51
-0.91
-6.31%
jan 1, 2016
11.125
-2.385
-17.65%
jan 1, 2017
10.94
-0.185
-1.66%
Ranking of countries by current statistics by years