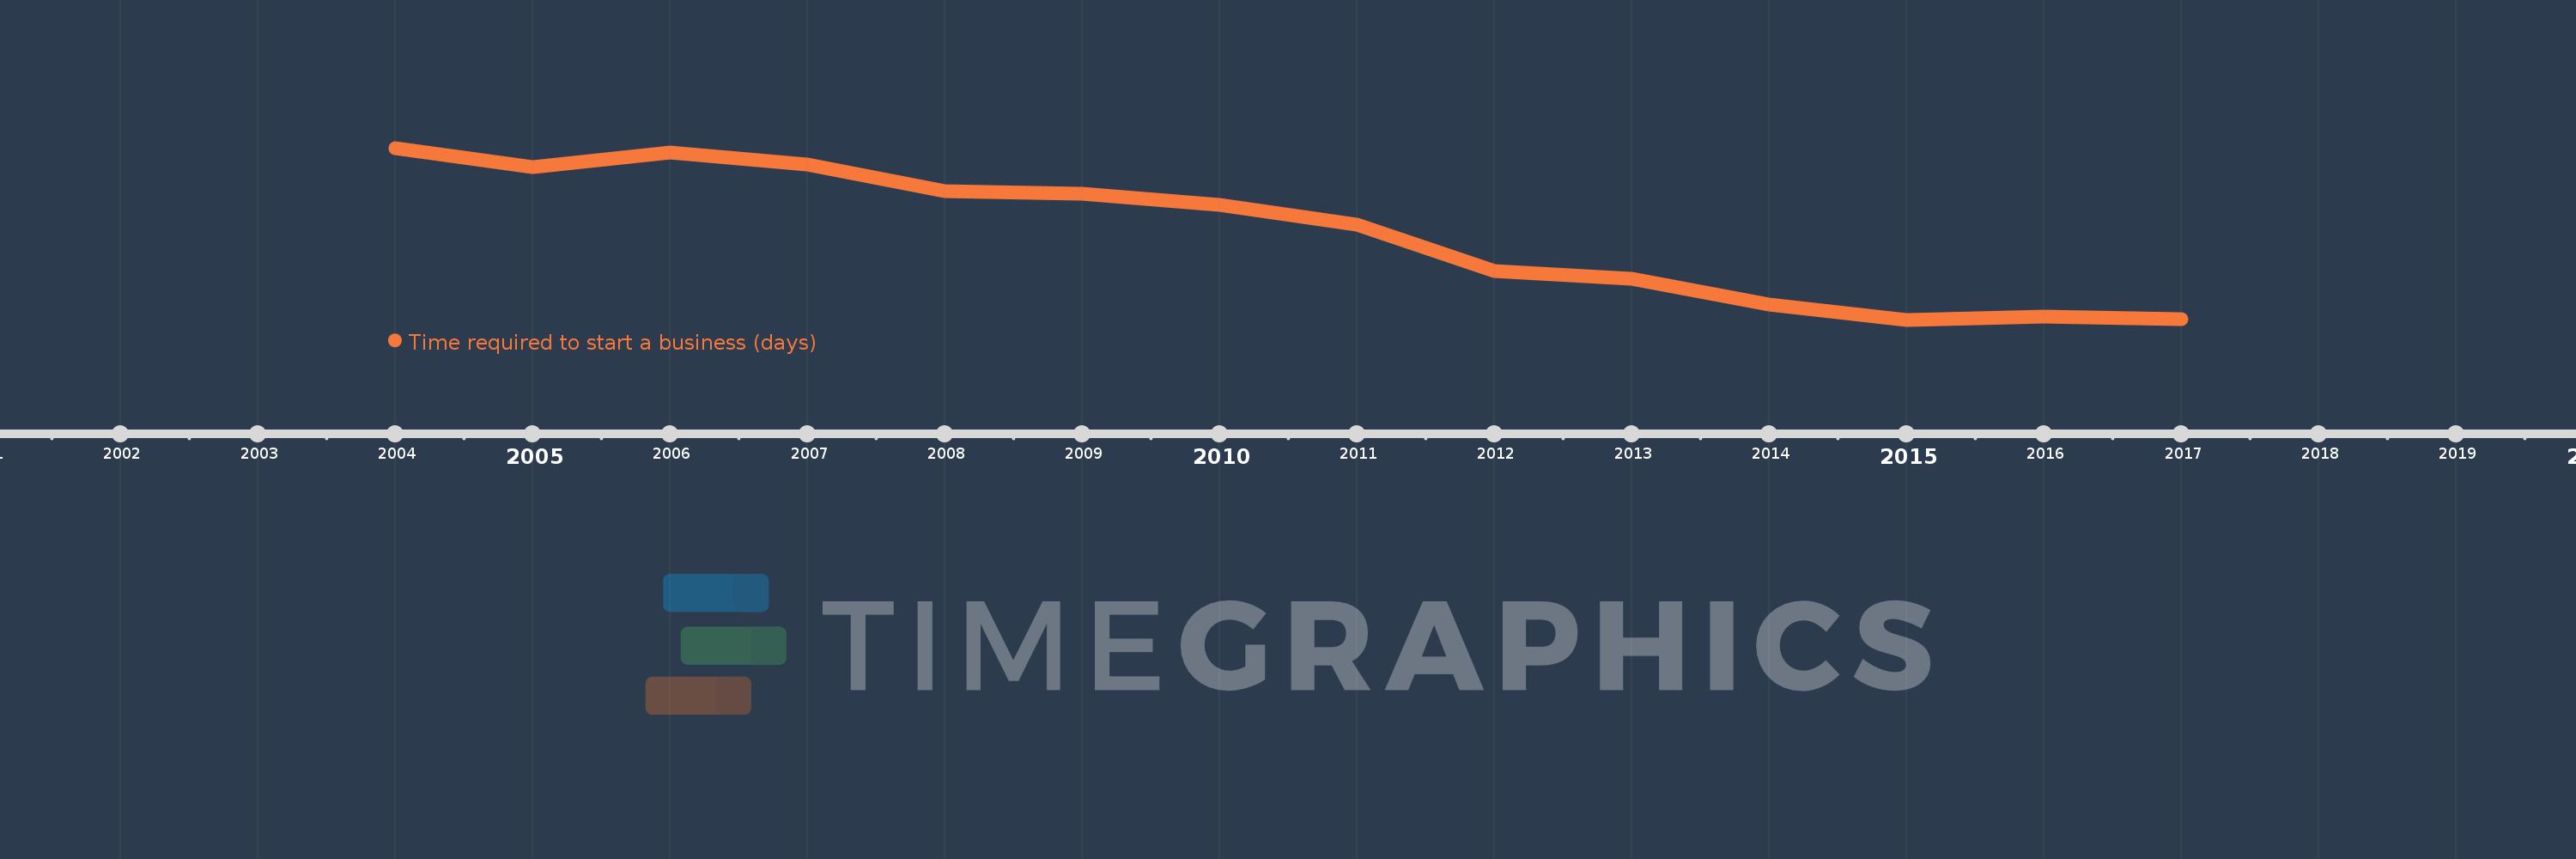
This timeline shows a graph from 2004 to 2017 of Heavily indebted poor countries (HIPC). No data until 2003. Number of actual observations by date: 14.
Source name:
World Development Indicators
Source organization:
World Bank, Doing Business project (http://www.doingbusiness.org/).
Categories, topics:
Private Sector
Last updated:
apr 23, 2017
Indicators value changes by year
Meaning:
41.266
Minimum:
22.132
jan 1, 2015
Maximum:
59.828
jan 1, 2004
At the date of observation
Value
Absolute change
Change from the previous value
jan 1, 2004
59.828
+59.828
0.0%
jan 1, 2005
55.618
-4.21
-7.04%
jan 1, 2006
58.878
+3.261
5.86%
jan 1, 2007
56.118
-2.76
-4.69%
jan 1, 2008
50.408
-5.711
-10.18%
jan 1, 2009
49.842
-0.566
-1.12%
jan 1, 2010
47.395
-2.447
-4.91%
jan 1, 2011
43.0
-4.395
-9.27%
jan 1, 2012
32.776
-10.224
-23.78%
jan 1, 2013
31.079
-1.697
-5.18%
jan 1, 2014
25.421
-5.658
-18.2%
jan 1, 2015
22.132
-3.289
-12.94%
jan 1, 2016
22.91
+0.779
3.52%
jan 1, 2017
22.321
-0.59
-2.57%
Ranking of countries by current statistics by years